You don’t need to spend your own money on Forex right away. Most brokers have demo accounts, which will let you test out the Forex market with virtual money using real market data. Using a demo account is a good way to learn how to trade or test your strategy. You can practice by pressing the buttons and grasp everything much faster.
All you need to trade currencies is internet access. Trading platforms for forex trading are called MetaTrader 4 and 5 (MT4 and MT5). They can be easily downloaded from every broker’s site. This will be your workplace, if you want to be a trader. You will use it to view and analyze the charts of financial instruments and make your trades.
The leaders among the Forex trading software are The MetaTrader 4 and MetaTrader 5 platforms from MetaQuotes Software Corporation. The fifth version of the terminal was launched in 2010. Since that time, it has been changed and upgraded several times. MT4 platform appeared in Forex brokers’ accounts in July 2005. Currently, both software products develop independently. So, what are the main differences of the 5th and 4th versions of MetaTrader?
Tip 1: If you want to stay in this business, leave “hope at the door and put a stop loss”.
Tip 2: When you start trading (open a position), start looking for signs that you are wrong. If you see them, then get out before you hit the stop loss.
Tip 3: Trading should be tiring, like working in a factory. If there is a guarantee in trading, it is: “excited traders drain their accounts”.
Tip 4: Don’t jump into the “next hot thing.” Develop your plan and follow it.
Tip 5: You trade other merchants of non-existent goods. You have to take into account (feel) the psychology and emotions behind trading.
In the topics covered so far, we learned how to analyze the market, where the entry and exit points should be, where to place a stop and where the order limit. If we have mastered all these techniques, we can say that we are ready to trade in the markets, but is it really so. If we can correctly predict the direction of the market, will we win?
In the 1930s, Ralph Nelson Elliot discovered a revolutionary theory (The Wave Principle – 1938), which to this day remains one of the most professional methods for forecasting financial markets. Elliott’s theory wins many adherents because it turns out that wave patterns describe the structure of market movements very well. This theory provides much greater opportunities for good forecasting of market movements, including for a longer time ahead. Over the years, followers of the theory have supplemented his work, but virtually all known market models were described in the basic theory by Elliott himself, more than 70 years ago. Robert Pretcher, Glenn Neely, and many others introduced many rules for performing wave analysis.
Proportional analysis refers to the length of price movements and is a mandatory part of the analysis of every analyst and trader. When trading, it is important to find not only the direction of the next movement, but also how far it will last. Otherwise, there is a possibility that we will not achieve the maximum possible profit or that we will have too high expectations and miss the right moment to go out. The techniques for detecting key levels are very different, but we will focus on the most famous ones.
The trading system is a set of rules that guide us when to find and when to close positions. These rules or instructions are based on technical analysis and are validated and proven to be correct, based on old data. The trading system allows us to free ourselves from the emotions that invariably accompany the trading processes. When a trader sets out to find a position, doubts and questions always arise that strain him mentally.
Computers and information technology allow traders to predict price trends without much effort. Technical indicators do all the work for traders, freeing them from the need to perform difficult mathematical and statistical calculations. In addition, they save time for traders to analyze the market. We must admit that the technical indicators are not crystal balls; they fail and lead to losses. But if traders focus on highly reliable chart and candle models, apply a few indicators to identify the perfect entry and exit points, they will always be ahead of the game. So, we recommend that you use technical tools in your internal transactions not only because it is convenient but also because it will help you minimize the impact of emotions on the decision-making process.
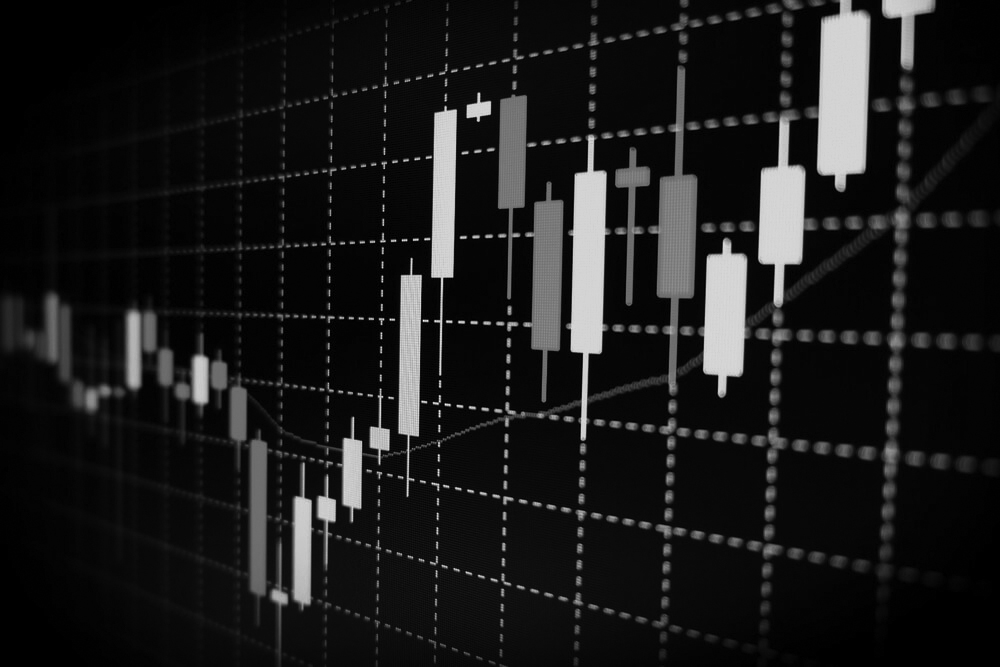
Japanese candlesticks offer a better visual perspective for predicting future market activities than bars. Intraday charts with clear Japanese candle patterns are invaluable for entry and exit strategies. Below is a comparison between a bar chart and a candlestick chart
Technical analysis – this is a study of market dynamics, most often using graphs to predict future directions. Primary the analysis is considered prices and the change in other factors (volume and open positions), is studied to confirm the correct direction of the price. The graphs reflect the influence of fundamental factors in the market and in the technical analysis takes into account the following tenets: