This publication aims to help fulfil the mission of “Applications In Life” Fondation to support and develop accessible and understandable financial education by improving financial culture and forward-thinking mentality of the civil society.
Computers and information technology allow traders to predict price trends without much effort. Technical indicators do all the work for traders, freeing them from the need to perform difficult mathematical and statistical calculations. In addition, they save time for traders to analyze the market. We must admit that the technical indicators are not crystal balls; they fail and lead to losses. But if traders focus on highly reliable chart and candle models, apply a few indicators to identify the perfect entry and exit points, they will always be ahead of the game. So, we recommend that you use technical tools in your internal transactions not only because it is convenient but also because it will help you minimize the impact of emotions on the decision-making process.
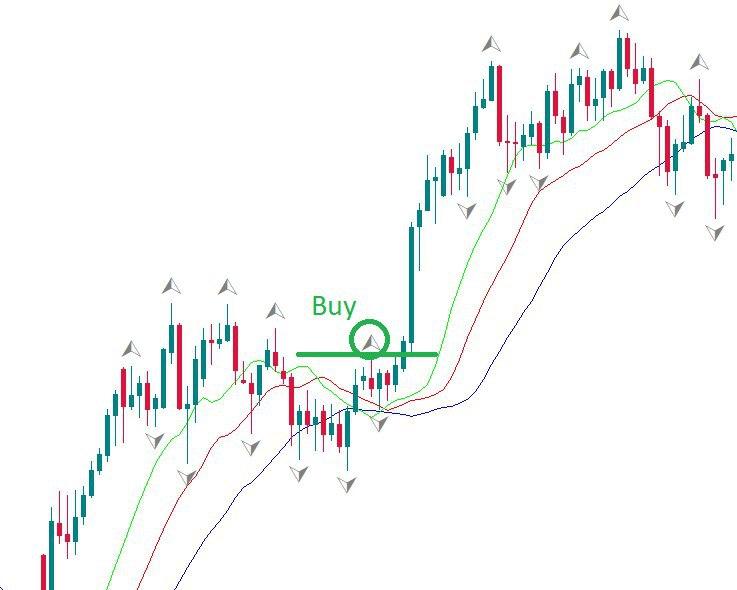
Moving average
The moving average is one of the widely used indicators in trading. Traders love it because of its simplicity and efficiency.
In this article, we will explain what this metric is and how to use it to maximize your profits.
The moving average is the trend indicator. It takes average price figures and, as a result, smooth price action from fluctuations.
Types of moving average
There are 4 main types of Moving Average that you can implement in MetaTrader. We will not give you complex formulas. It is more important for you to understand the idea of each type.
Simple moving average
Traders usually use Simple Moving Average. This type of MA shows average prices close to those of the period under review. All prices are equal in value, as a result. For example, if we have a 10-day MA, we calculate the sum of 10 close prices and divide it by 10. Each time a new closing price is formed, the oldest one is no longer counted.
Exponential MA and linearly weighted MA
The exponential MA and the linearly weighted MA are quite similar. They calculate the last prices with the higher coefficient. As a result, these MAs most reflect price movements and signal faster. Be careful! These MAs give quick signals but some of them may be false.
Smoothed MA
Smoothed MA is based on Simple MA. It is easy to determine its basic function after first looking at its name. This MA clears most price movements from fluctuations. This MA is the best trend setter.
How to implement MetaTrader
MA is set in MetaTrader so you do not need to download it. Go to Insert – Find Indicators – Go to Trend – and you’ll see a moving average. It is more important to apply the correct settings.
Period
Period is the number of candlesticks to be taken into account in the calculation. The longer the period, the smoother the MA and the more accurate the signals. The closer the MA is to the price, the shorter the period..
There is no uniform rule on what MA period to use. Analyzing large time frames, traders prefer MAs with periods like 50, 100 and 200. To trade smaller time frames, investors prefer small periods like 9, 12 and 26.
Price
There are several options. They can be close, open, high, low, medium, typical and weighted close prices. Usually, however, traders use the near price.
Shift
This setting is used to drag the indicator back and forth over time. The MA will move up or down, as a result.
How to use Moving Averages in Forex trading
One thing we need to tell you. MAs will give delayed signals because they calculate the last close price. Take it into consideration while using them in your trading.
- This is trend indicator, and we will start with a trend detection. If you want to find out whether the market is bearish or bullish, a cross will help you.
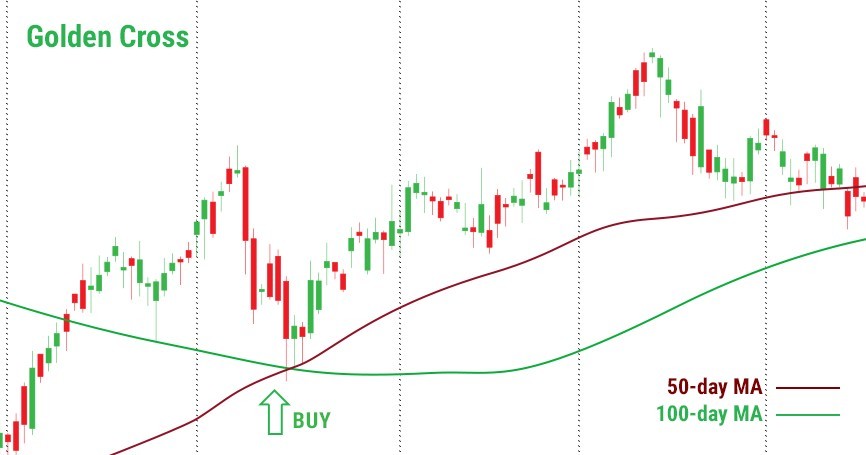
Golden cross
When a MA with a smaller period crosses the MA with a larger period from the bottom up, it is a buy signal.
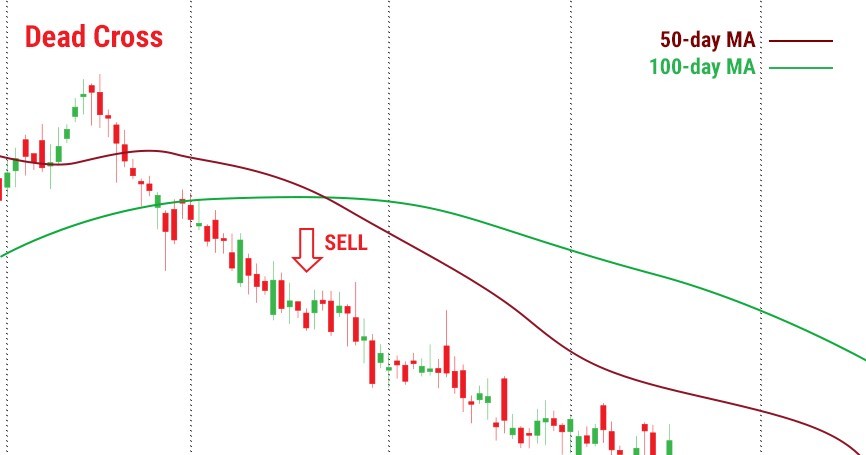
Dead cross
When a MA with a smaller period crosses the MA with a larger period upside down, it is a signal for sale.
- More about the trend feature. If the indicator goes down, this is a downward trend. If MA goes up, this is an upward trend.
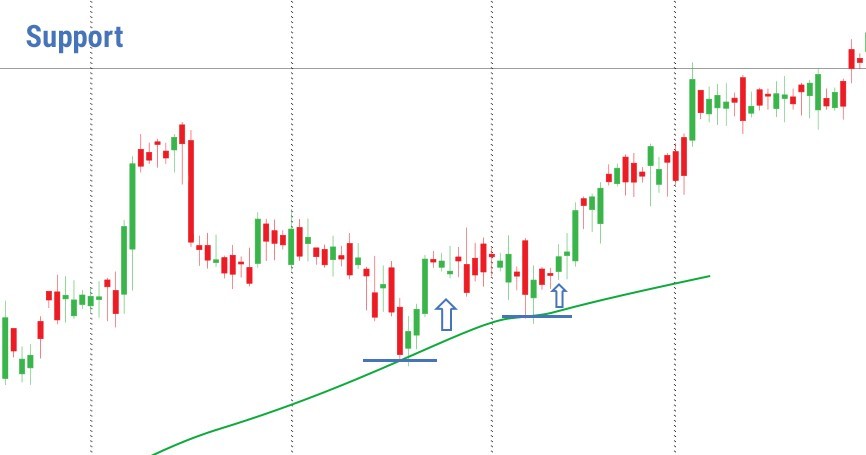
- The Moving Average is used exclusively as support and resistance levels. The strength of the levels depends on the MA period. The longer the period, the stronger the support / resistance. The time frame also plays an important role. The longer the term, the stronger the MA will be. If you compare the 200-hour MA with the 200-day MA, the latter will be at a higher level and as a result, the price is more likely to fluctuate near it.
Using MA as levels of support and resistance, we get a chance to determine the levels to open a position.
When the price fails above MA, it can be a signal for purchase. On the contrary, the break below the MA will signal a sale.
Tip: If the price hits MA several times, it means that the reversal is close.
MA and other indicatorsThe big advantage of MA is that they are not the only indicator; they are part of other technical indicators. The most well-known MO based indicator is MACD. You can also find MA in trading tools such as Alligator, Bollinger Bands, Ichimoku Kinko Hyo.
We always remind traders that there is no perfect indicator, so it is important to combine them to get stronger alerts.
What indicators are best combined with MO?
It’s always a good idea to use candlesticks. They give strong signals for reversal and continuation of the trend. Other indicators that can be used are oscillators.
Remember, you need at least 2 matching alerts to start trading
In short: let’s summarize what you read above. Moving Average is the technical indicator of a trend that reflects price movements. It gives slow signals but is still very useful as the signals are strong. Buy when the price is above MA and when you see a gold cross. Sell when the price is below MA and you fall into a dead cross.
MACD (Moving Average Convergence/Divergence)
The MACD is one of the most potent technical tools in the arsenal of many traders. The indicator is used to check the strength and the direction of a trend as well as to define reversal points.
The MACD stands for the Moving Average Convergence Divergence and shows the relationship of the price’s two Moving Averages.
How to implement MACD
You don’t need to download it, because MACD is included in MetaTrader default indicator kit. Go to “Insert”, find “Indicators” and then “Oscillators” – and you will see the MACD. In a separate window below the price chart, the indicator will appear.
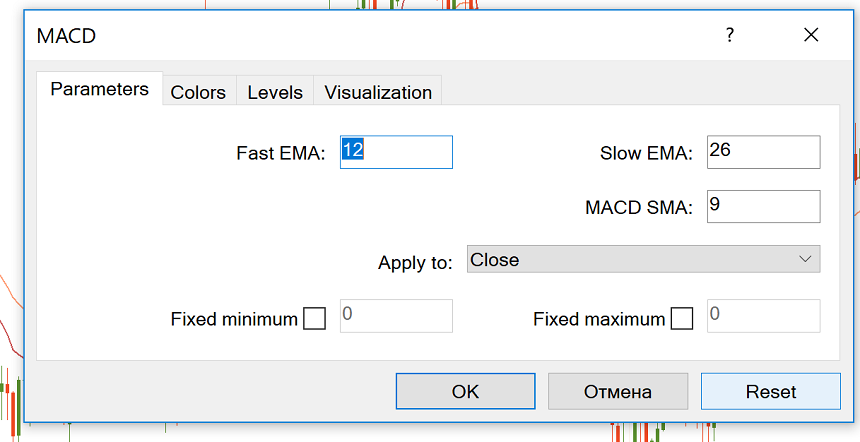
The classic settings include 12 and 26 EMAs and a Signal Line (SMA) with a period of 9. You can choose other parameters depending on your trading style and goals. For example, the MACD (5,35,5) is more sensitive and might be better suited for weekly charts.
To avoid false signals, increasing the number of periods for the signal line will reduce the number of crossover signals. With a shorter signal line EMA, trade signals will occur later than they would.
The indicator can be applied to any timeframe, but it’s preferable to choose those from H1 and bigger.
How the MACD indicator works
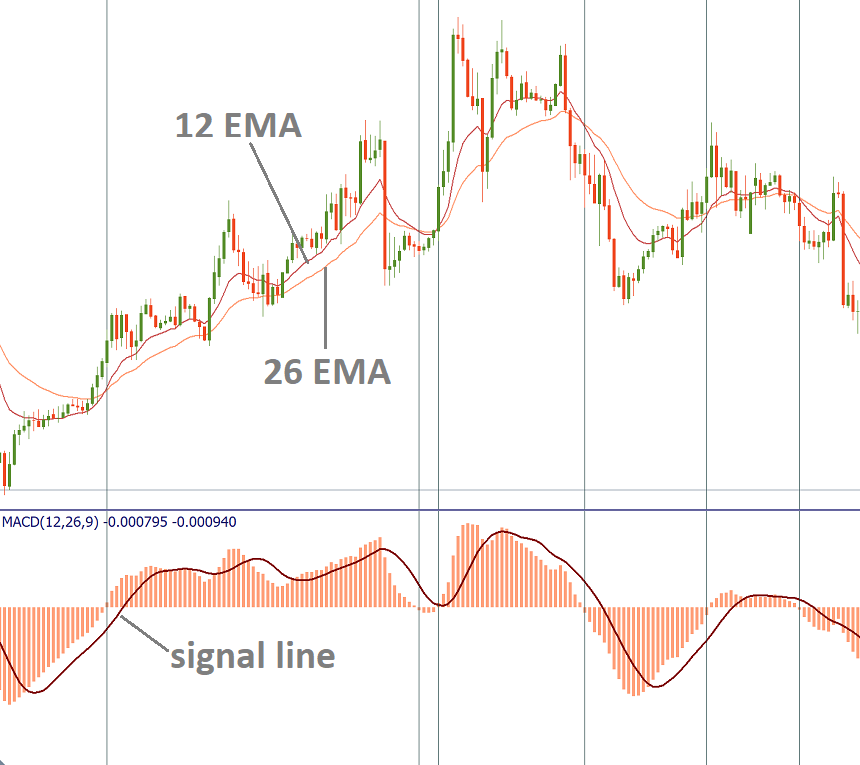
The main idea behind the MACD is that it subtracts the longer-term moving average from the shorter-term moving average. In this way, it transforms the trend indicator into momentum and combines the characteristics of both.
The MACD has no bounds, but it has a zero mean, around which it tends to oscillate as the moving averages converge, intersect and diverge.
When the moving averages move towards each other, convergence occurs. Divergence takes place when the moving averages move away from each other. The MACD histogram is below 0 when the shorter MA is below the longer MA and above 0 when the 12-period MA is above the 26-period MA. As a result, positive values of the histogram point at a bullish trend, while negative values mean a downtrend.
How to use MACD in Forex trading
All in all, the market is bullish when the MACD is above 0 and bearish when it’s below 0.
MACD provides traders with several types of signals: cross signal lines, overbought / resale levels, cross center line crossings, and differences.
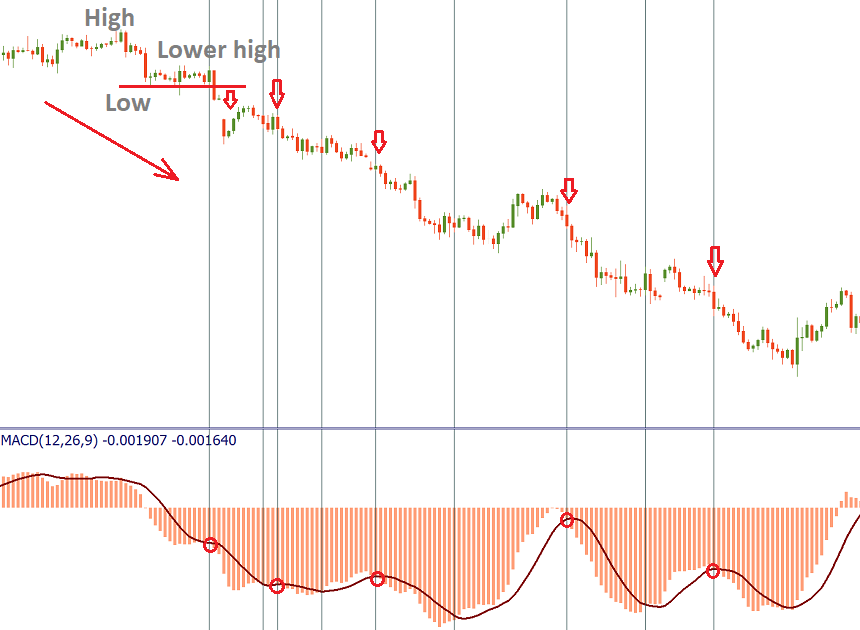
- Signal line crossovers
When the MACD starts rising and then goes above the signal line, a bullish crossover happens. A bearish crossover happens when the MACD starts declining and crosses the signal line to the downside.
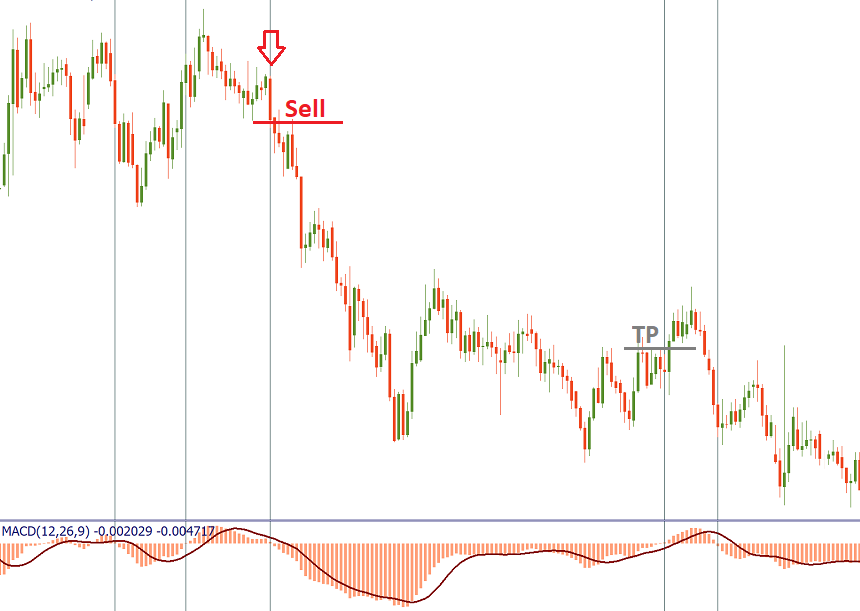
When the price range in rather narrow, the MACD works best in trends. It may be a good strategy to establish a trend and then to use only those MACD signals which are in line with this trend.
On the picture below, you can see that in a downtrend it’s wise to trade only negative MACD crossovers with the signal line.
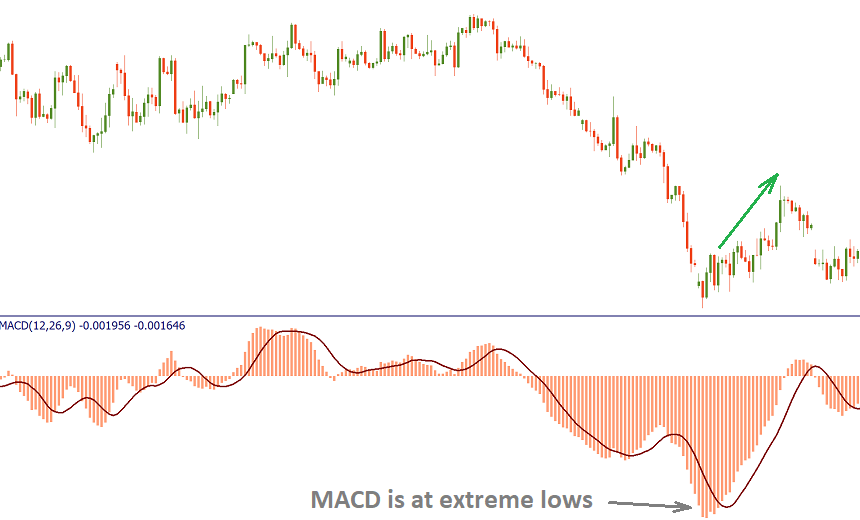
- Overbought/oversold levels
It’s also possible to use the MACD as an oscillator. The market always returns to the mean and the fast MA always returns to the slow one, this is common knowledge. The bigger the difference between the moving averages (the lower the MACD histogram is), the more bullish / bearish the market is, and the greater the likelihood of a price correction that will bring MACD back to 0.
As a result, it’s possible to trade extreme highs/lows of the MACD as a sign that the market is overbought/oversold. As the indicator has no lower or upper limits, you should judge extremes by the visual comparison of the MACD levels. You have to be aware that this kind of signals requires confirmation from price action or other technical indicators.
- Zero line crossovers
When the MACD moves above 0 to turn positive, a bullish zero line crossover occurs. It can be used as a confirmation of an uptrend. When the MACD gets below 0 to turn negative, a bearish zero line crossover takes place. This can be used to confirm a downtrend.
The MACD is giving here trading signals similar to a two moving average system. One good strategy is to buy when MACD rises above the zero line (holding the position until the price returns below 0) and sell when MACD goes below the zero line (and close the trade when the price returns above 0). However, this approach is profitable only when strong trends emerge. During the volatile sideways market, this may result in losing trades.
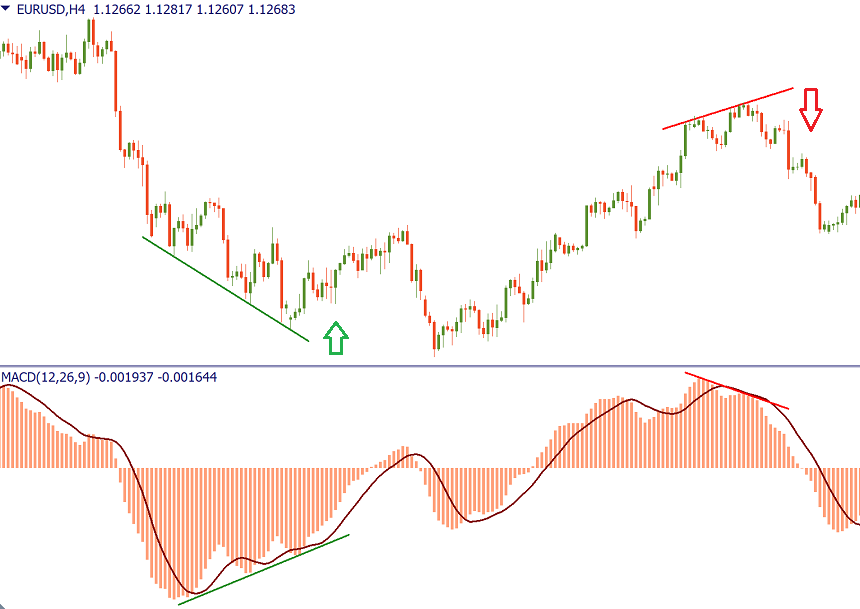
- Divergences
Also, note the divergence / convergence between metric and price. Bullish convergence is formed when the price sets lower lower levels, while the MACD histogram lows rise (buy signal). The bearish divergence is formed when the price rises, while the MACD highs become lower (signal for sale).
Advantages and disadvantages
One of the biggest advantages of the MACD is that it’s both a trend and momentum indicator. However, like all other technical indicators, the MACD isn’t perfect. Its main flaw is that it gives the signals later than the price action itself. In addition, you have to note, that the MACD doesn’t provide ready-to-use stop loss or take profit levels.
Conclusion
The MACD is a very useful technical indicator. It produces a variety of signals and can represent a solid foundation of a trading system. You can filter out false signals by using the MACD in combination with other tools of technical analysis. For example Envelopes and ADX indicator.
CCI (Commodity Channel Index)
The Commodity Channel Index (CCI) is a technical indicator developed by Donald Lambert in 1980. It shows when the market is overbought / resold and helps to assess the direction and strength of a trend as well as discover new trends.
How to Deploy CCI
CCI is included with the default MetaTrader indicators, so you do not need to download it. Go to Insert, find Indicators, and then Oscillators – and you’ll see the stock channel index. In a separate window below the price chart, you can find the indicator.
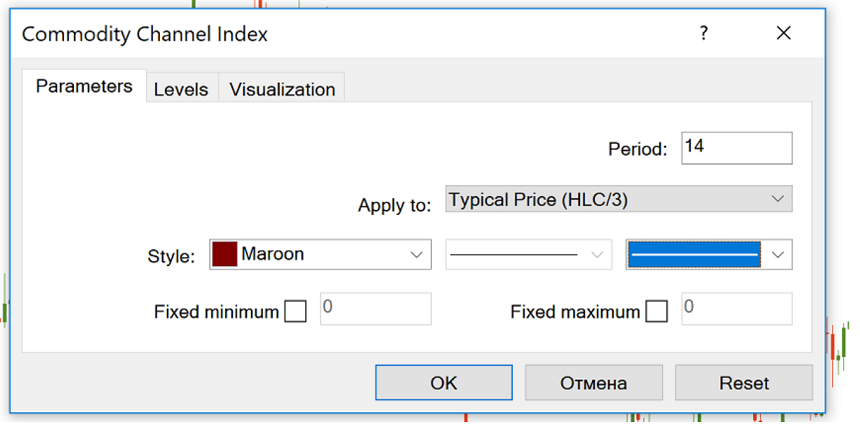
The indicator’s dynamics depends on the number of periods that were used to form it. The smaller the period, the more volatile will be the indicator and the more time it will spend outside of the ±100 range. MetaTrader proposes “14” as the CCI period, by default. Another popular setting is 20 periods.
How to interpret
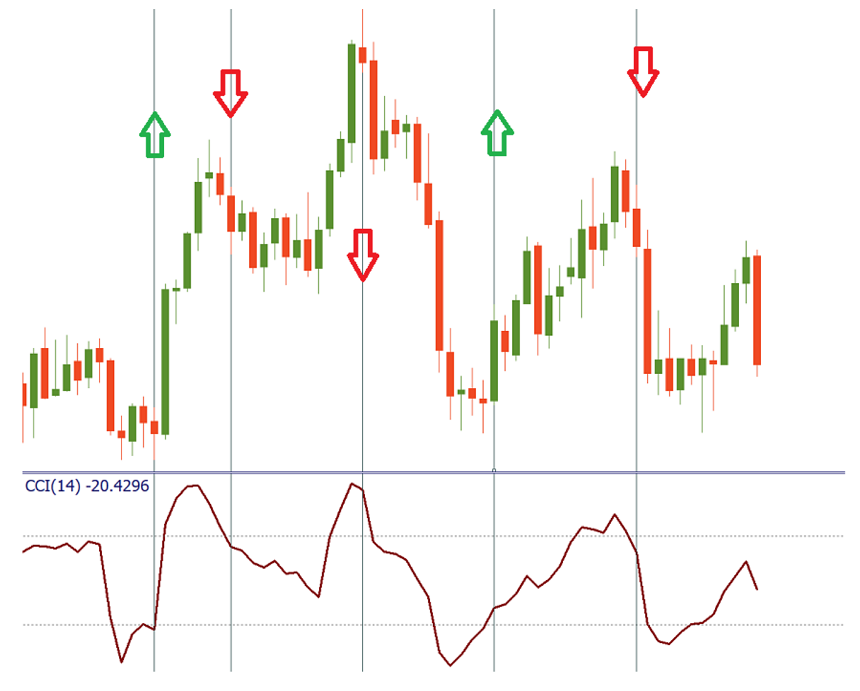
CCI measures the difference between the historical average price and the current price. The indicator oscillates across a center line. When it is above zero, it means that the price is above the historical average and when it is below zero – the price is below the historical average.
Overbought/oversold conditions. As you can see, the levels of +100 and -100 are marked in the CCI chart. If the indicator rises above +100, it means the pair is overbought and the possibility of a downward correction has increased. When CCI reverses down from positive or near-zero readings and makes its way to -100, it points to an emerging downtrend.
A decline below -100 means the downtrend had been strong and the market became oversold. When CCI turns up from negative near-zero readings and starts moving toward +100, it’s a sign of an emerging uptrend.
Notice that the indicator doesn’t have an upside or a downside limit as such, although it will always tend to return to the median 0 level. As a result, it’s necessary to look to past readings of the indicator to get a sense of where price reversed. This necessity to interpret things makes the indicator somewhat subjective.
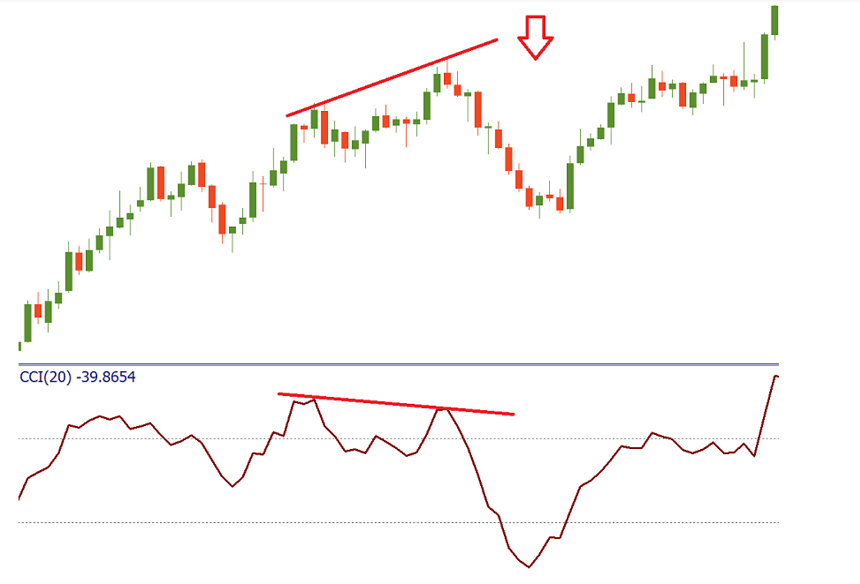
Divergence/Convergence.
The Divergence occurs when the price forms a higher maximum, but the CCI forms a lower one. This can be confirmed by breaking the CCI below zero or a break of support in the price chart. Conversely, convergence occurs when the price forms a lower low, but the CCI forms a higher low. It can be confirmed by breaking the CCI above zero or breaking the resistance in the price chart.
Conclusion
CCI has its drawbacks, as any other technical indicator. Apart from the subjectivity we mentioned earlier, it’s necessary to point out that the indicator is lagging behind the price. As a result, the signals may turn up too late and thus be false. To solve the problem, you can use CCI together with the analysis of price action as well as with other technical indicators that will confirm or reject its signals.
Stochastic Oscillator
The Stochastic indicator developed by George C. Lane at the end of the 1950s and is actively used among traders all over the world ever since. It evaluates the market’s momentum and compares the closing price to a price over a certain period of time. The idea behind the indicator is that in the bullish market prices will close close to the high ones and in the bearish market prices close close to the low ones.
The Stochastics indicator can show when the asset you trade is oversold or overbought. It signals when the market’s momentum is slowing down. This, in turn, means that a change in trend is likely. The observation of the indicator may provide you with trade signals and ideas, as a result.
How to implement indicator
In the default set of MetaTrader, the Stochastics indicator is included. You can add it to the chart from “Insert” – “Indicators” – “Oscillators” and then select “Stochastic Oscillator”.
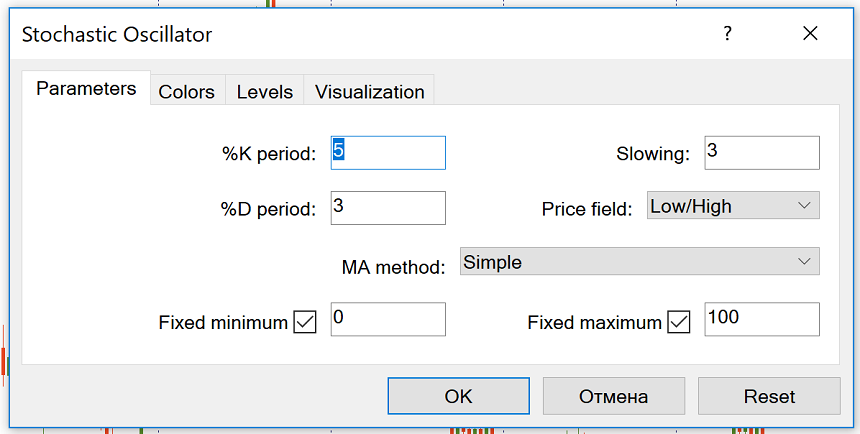
The stochastic oscillator can be used in all time frames. The default settings are 5, 3, 3. Other commonly used stochastic settings include 14, 3, 3, and 21, 5, 5. Stochastics are often called fast stochastics with tuning 5, 4, slow stochastics with tuning of 14, 3, and Complete stochastic with settings of 14, 3, 3.
Slow Stochastics reduces the number of false crossovers and thus filters out some of the false signals, while Fast Stochastics responds more quickly to the changes in the market price. It is up to you to choose the parameters you want.
How to trade using Stochastic
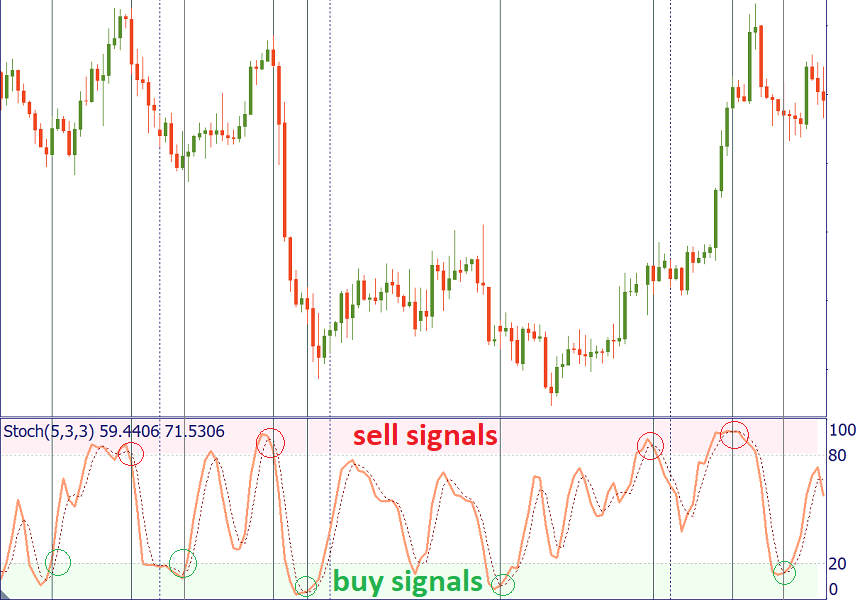
The stochastic is measured in% from 0 to 100. The indicator is represented by two lines: the fast one, also called% K (solid green line), and the slow one, called% D (red dashed line). Line% D is the average of% K.
These lines intersect when the impulse changes. The buy signal is when% K (green) crosses% D (red) from the bottom up. Sell when% K crosses% D from top to bottom.
Like any other indicator, Stochastics does not produce signals that are 100% cost effective. There are two ways to make the signals of this indicator more accurate:
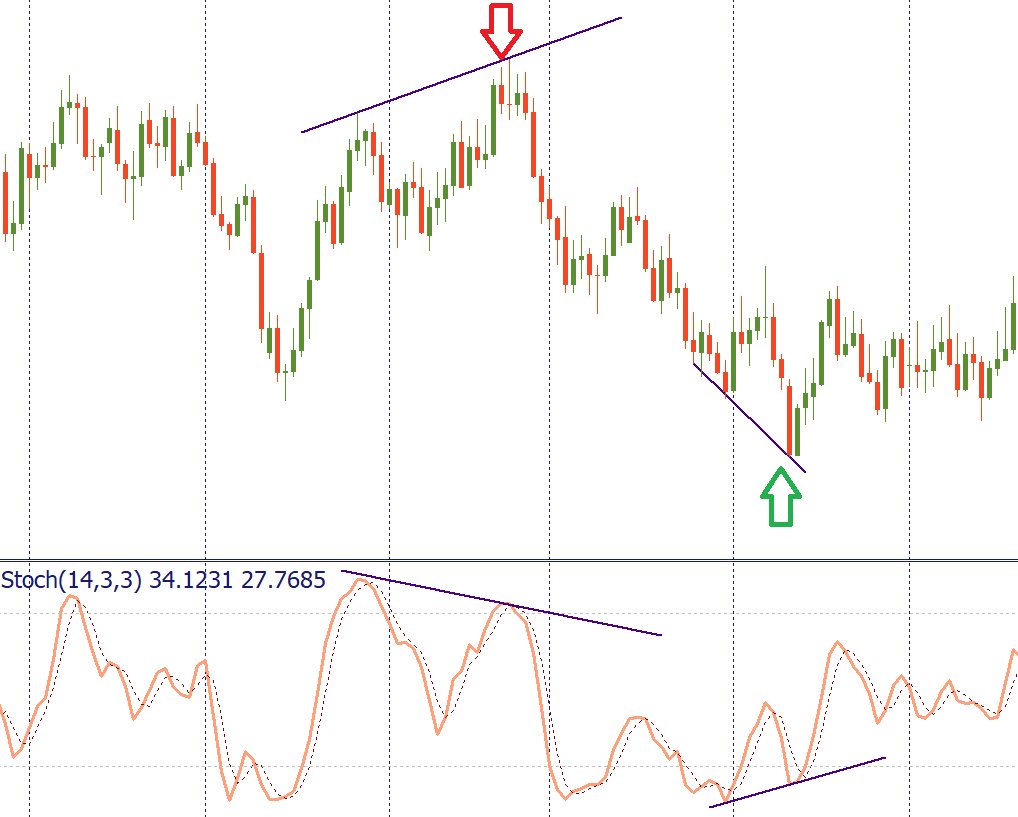
- Use the alerts generated when the crossover occurs in the end zone (over 80 for a sell signal and below 20 for a buy signal).
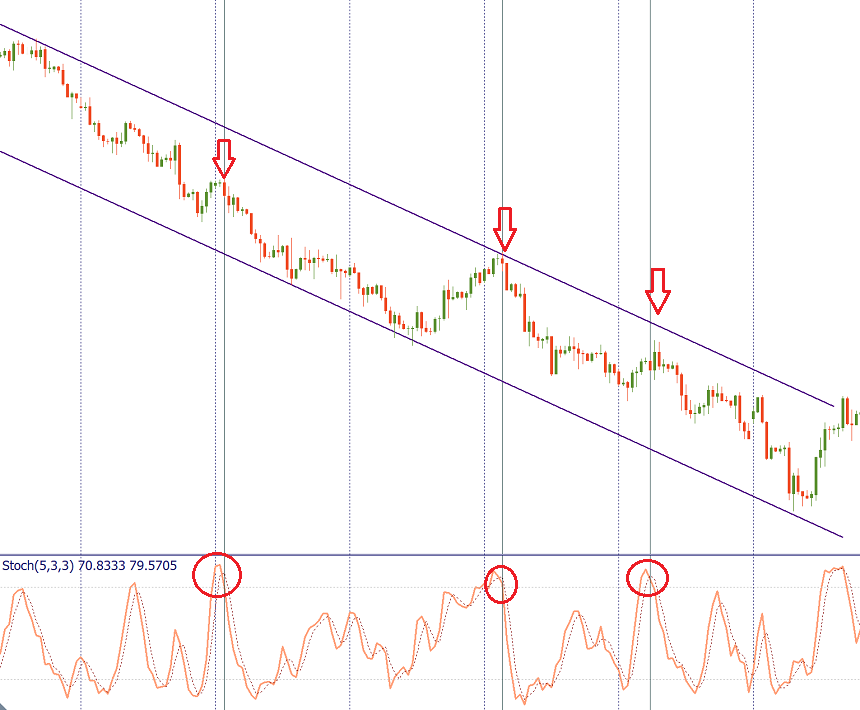
- Take into account the trend on a larger timeframe and trade in line with it. For example, if you use Stochastic on H1, check the trend on H4. If there’s a strong uptrend, don’t take the sell signals as the price may stay in the overbought area for extended periods of time. Instead, focus on the buy signals generated by Stochastics and you will have the benefits of trend trading.
In addition, as with other oscillators, note the situations where the stochastic oscillator diverges from the price chart. A sell signal occurs when the price is higher, but the stochastic forms a lower maximum (bearish differences). A buy signal appears when the new low price is not confirmed by the oscillator.
It is recommended to use the Stochastic Oscillator in combination with other tools of technical analysis (Moving Averages, Heiken Ashi, Alligator, etc.)
Conclusion
The Stochastic Oscillator is very powerful tool of technical analysis. It has several purposes and can be the basis of a good trading system.
Relative Strength Index
Оne of the most popular technical indicators among traders is Relative Strength Index (RSI). It was developed by J. Welles Wilder in 1978 to measure the speed and the change of price movements. The indicator also helps to determine the overbought/oversold state of the market in order to buy low and sell high.
How to implement RSI
To add the RSI to a chart, select “Insert” – “Indicators” – “Oscillators” – and you will see the “Relative Strength Index”.
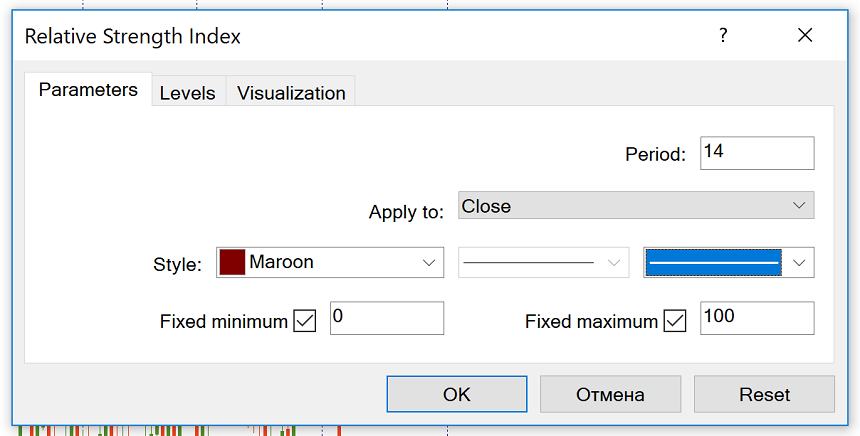
By default, MetaTrader will suggest you have “14” as the number of periods. You can change this parameter if you want. Short-term traders typically use a 9-period RSI, while those who prefer longer-term trades opt for 25-period RSIs. In general, the smaller the period, the more fluctuations the indicator will make.
How to interpret the relative strength index
Indicator readings fluctuate between 0 and 100. You can also add an average line of 50. If RSI is above this point, the momentum increases and it makes more sense to look for buying opportunities. When the RSI drops below 50, it is a sign of a new bearish trend, so consider opening a sales transaction.
The market has been re-purchased or resold
Like other oscillators, RSI helps tell when an asset is being redeemed or resold. For RSI, you should monitor levels of 70 and 30. If RSI rises above 70 restricted, it means that the market is overbought and can be repaired. If the RSI falls below the 30th line, the asset is resold and may move to higher levels.
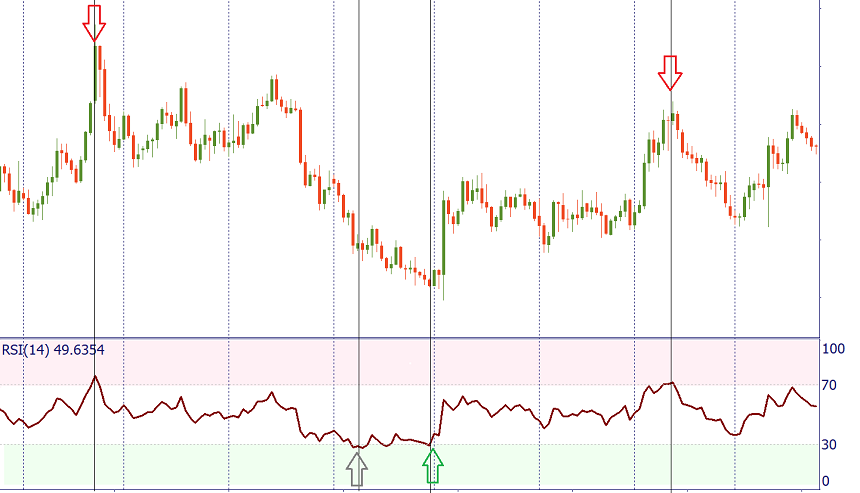
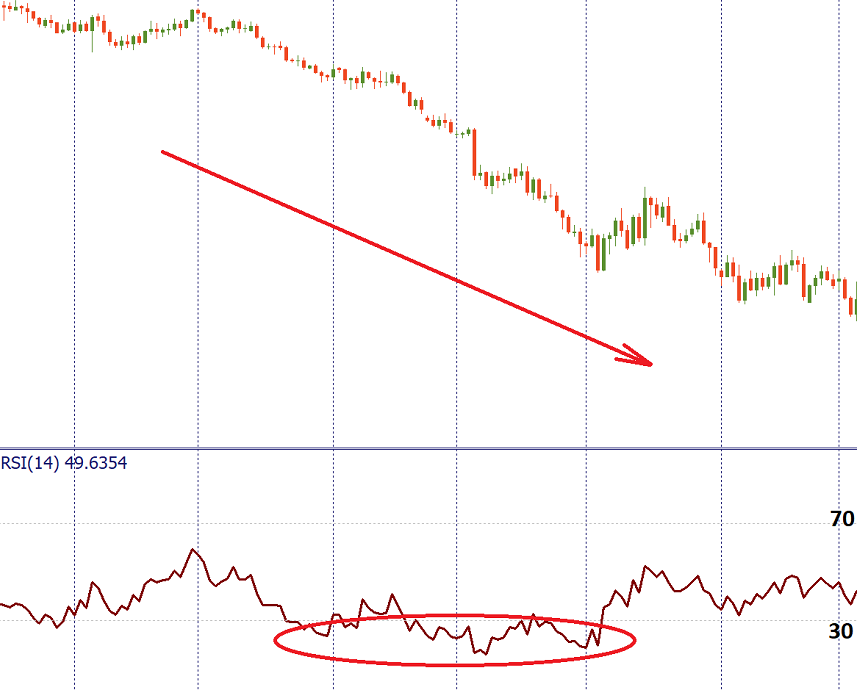
Notice, however, that this approach is not suitable for trading in strong trends when the RSI may stay overbought or oversold for long periods of time. If you have evidence that there’s a strong trend in the market, consider selling when RSI is oversold in a downtrend, and buying when RSI is overbought in an uptrend.
You can increase the quality of RSI signals when you follow only those signals that are in the direction of the trend when the indicator leaves critical levels. For example, you can buy during an uptrend when RSI is above 30.
The market reversal
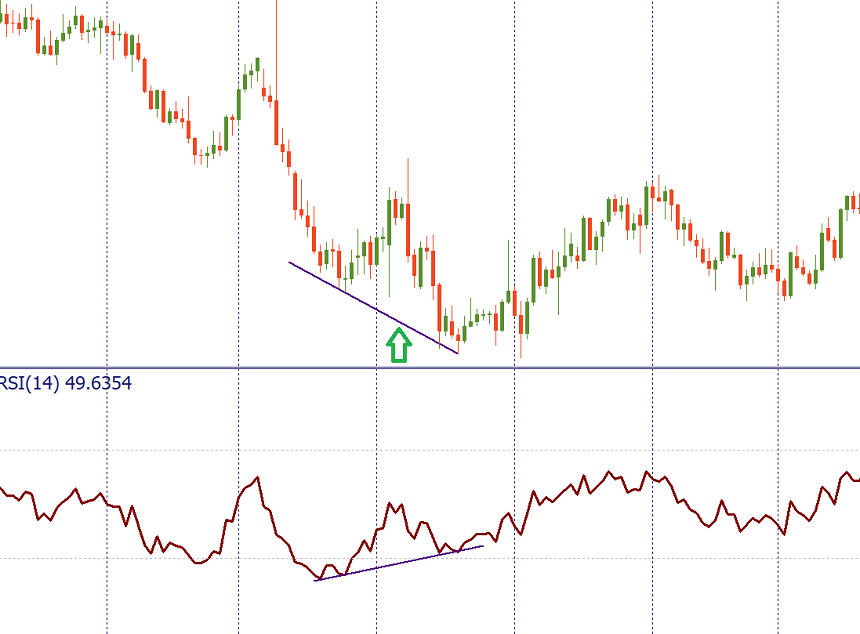
Moreover, the difference between the RSI and the price may alert the market to turn over. When the new high of the price is not confirmed by the new high in the RSI, it is a bearish divergence, which is a negative signal. When the price forms a lower low but the minimum of RSI is higher than the previous one, it’s a divergence in favor of bulls.
RSI is often used in combination with another oscillator, MACD. While RSI measures price changes in relation to recent highs and lows, MACD measures the relationship between two EMAs. Together, RSI and MACD are powerful combos.
Conclusion
The competent trader must know what RSI is and how to use it. Make sure that your analysis is not based solely on RSI, but includes a price action survey as well as other technical indicators. Remember that the signals of the Relative Strength Index are the most reliable when they correspond to the long-term trend.
Bollinger bands
One of the classic trend indicators is the Bollinger bands (BB) indicator, developed by John Bollinger. His book Bollinger on Bollinger Bands contains a detailed description of how to use it on its own as well as with other tools of technical analysis. BB is very popular among traders all over the world. It is a type of statistical chart characterizing the prices and volatility over time of a financial instrument or commodity, using a formulaic method.
About Bollinger bands
The indicator is made up of 3 lines – a middle band and two outer ones. The middle band is moving average, usually with the period of 20. Usually the outer bands are set 2 standard deviations above and below the middle band.
The Bollinger bands is very similar to the Envelopes indicator. The difference is that the borders of Envelopes are situated above and below the moving average at the fixed distance in %, while the borders of the Bollinger bands are calculated on the basis of the constantly changing standard deviation.
How to implement
In the default set of MetaTrader, the Bollinger Bands is included. You can add it to the chart from “Insert” – “Indicators” – “Trend” and then choosing “Bollinger bands”.
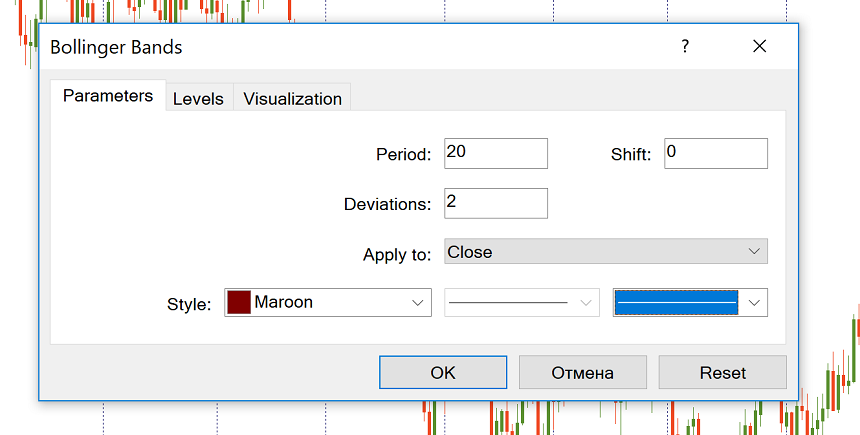
MT by default, will offer you 20 as period and 2 for deviation. You can change these parameters if you want to. It’s recommended to use periods from 13 to 24, while the deviation should be in the range between 2 and 5. For example, it’s possible to use 50 and 2.1 for longer timeframes and 10 and 1.9 shorter timeframes. Notice that the smaller the period, the more trading opportunities will be offered by the indicator. The number of false signals, however, will be greater as well. At the same time, the indicator becomes less sensitive, when the period is big. This is not suitable for the markets with low volatility.
Before you make a conclusion, it would be wise to adjust the Bollinger bands for the asset you trade. If the price crosses the upper or the lower band too often, it’s necessary to increase the period. There’s a sense to reduce the period, If the price rarely reaches the outer bands, .
The BB can be used on all timeframes, although the indicator is more common for the intraday one. The Bollinger bands can also be applied to an oscillator that is drawn in a separate window below the price chart. For example, you can apply BB onto an RSI by selecting “Previous Indicator’s Data” or “First Indicator’s Data” in the Bollinger bands’ “Apply to” drop-down menu.
How to use Bollinger bands to trade Forex
The assumption is that the price spends 95% of the time between the outer Bollinger bands and only 5% of the time outside of them.
Bollinger bands help to determine how big is the deviation from the average price of a currency pair.
The middle line may be used as a level of support/resistance, while the outer borders can act as profit targets. There are also strategies that suggest reversing trade from outside bands.
The slope of BB and the position of the price relative to the middle band allow judging the direction of the current trend. It’s an uptrend, if Bollinger bands have an upward bias and the price tends to be above the middle line.
It’s a downtrend, if the band’s bias is negative and the price spends the majority of time below the middle line.
Bollinger Bands as an indicator of volatility
The key feature of the BB is that the indicator’s lines react to the market’s volatility: bands widen when the volatility is high (for example, when an important news release is out) and narrow when it declines.
As a result, the Bollinger Bands help to notice the moment when the market switches from the calm to the active state. When the bands come closer to each other they tell us that we are trading in the non-volatile market and that a volatile period is looming on the horizon. As a result, it’s possible to expect a breakout of the recent range.
You can see the example of this at the picture below: the bands compress and then the price breaks above the resistance and make big moves to the upside.
During a market trend, if the groups expand, this indicates a continuation of the trend. If they become narrow, this may signal that the trend is weakening and may soon reverse.
Trading traffic outside the external borders
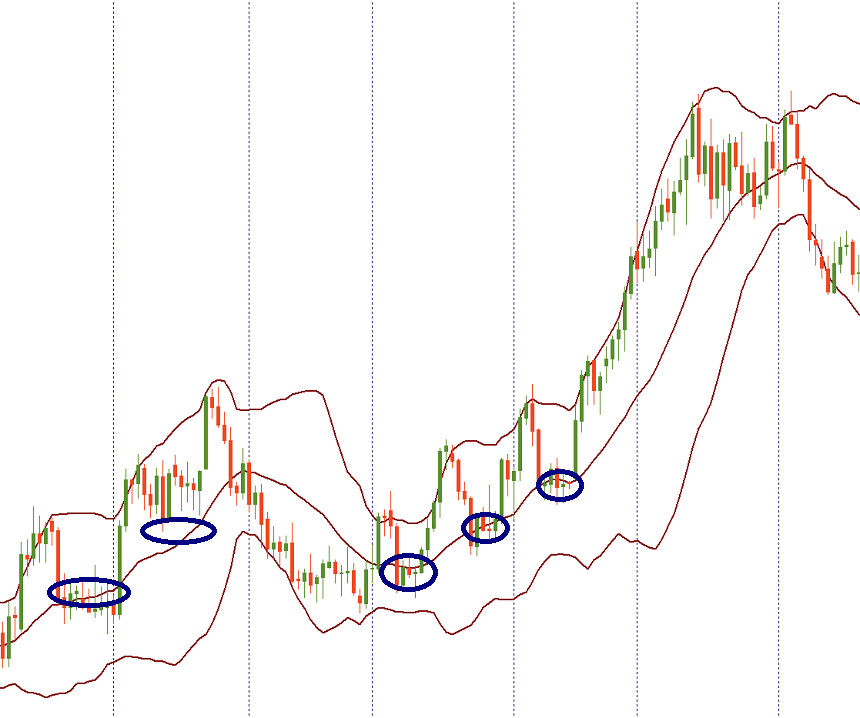
Usually, when the price exceeds the Bollinger’s outer bar, this signals the beginning or continuation of the trend. If prices touch and break the top of BB, this is an upward trend. If the price continues to attack the lower BB, this is a downward trend.
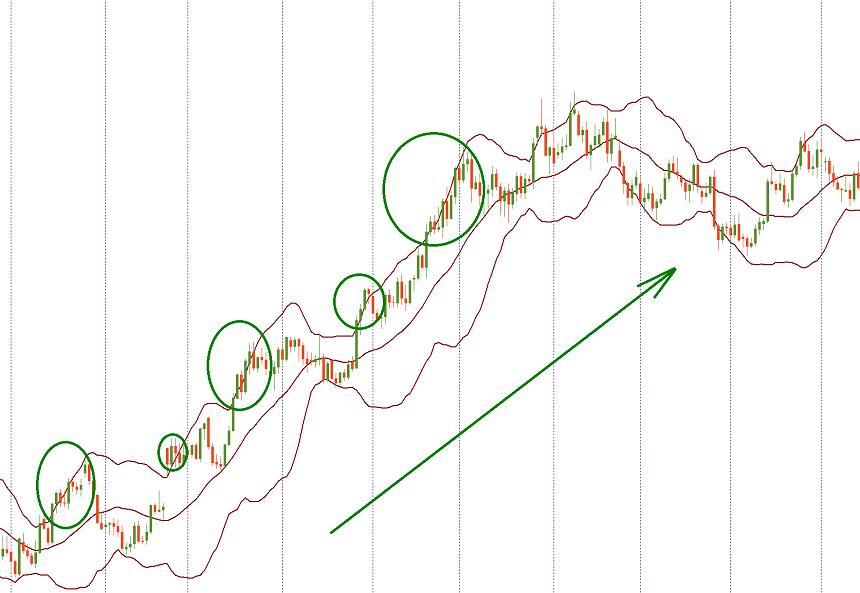
Most often the price spends no more than 4 candlesticks beyond an outer Bollinger band. Then a correction takes place. Note that when the market is trending, the price can spend a lot of time in the area / on one of the outside lanes.
Trading a reversal from the outer bands
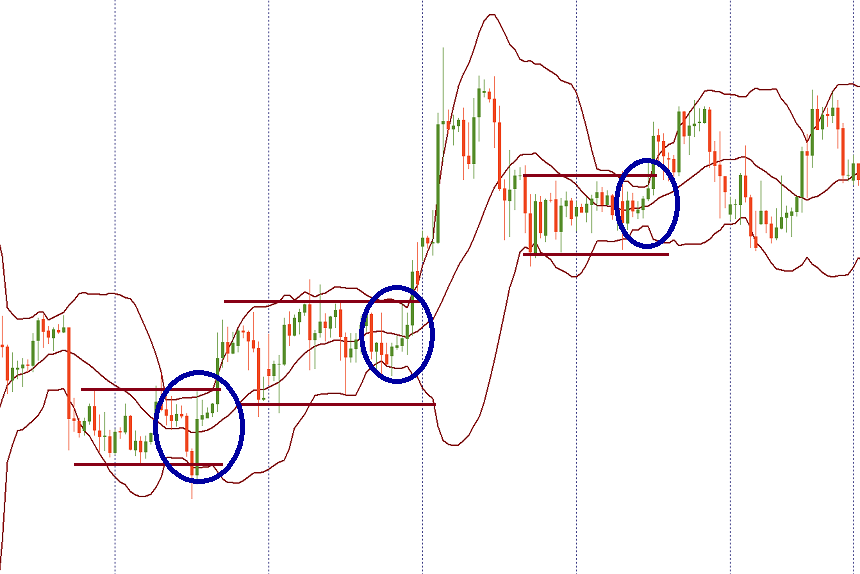
The Bollinger bands can also act as an oscillator. When the price reaches the upper limit, the asset is traded at a relatively high price and is considered to be overpriced. When a price approaches the lower limit, the asset is traded at a relatively low price and is considered to be resold. It’s common knowledge that overbought and oversold conditions lead to a correction.
However, if the trend is strong, the price can stay at the upper/lower Bollinger band or even beyond it without retracement for a prolonged period of time as we have learned from the previous passage. As a result, if you want to trade on the pullback from the upper or lower Bollinger band, you will need a confirmation of the market’s reversal from candlestick patterns or another indicator.
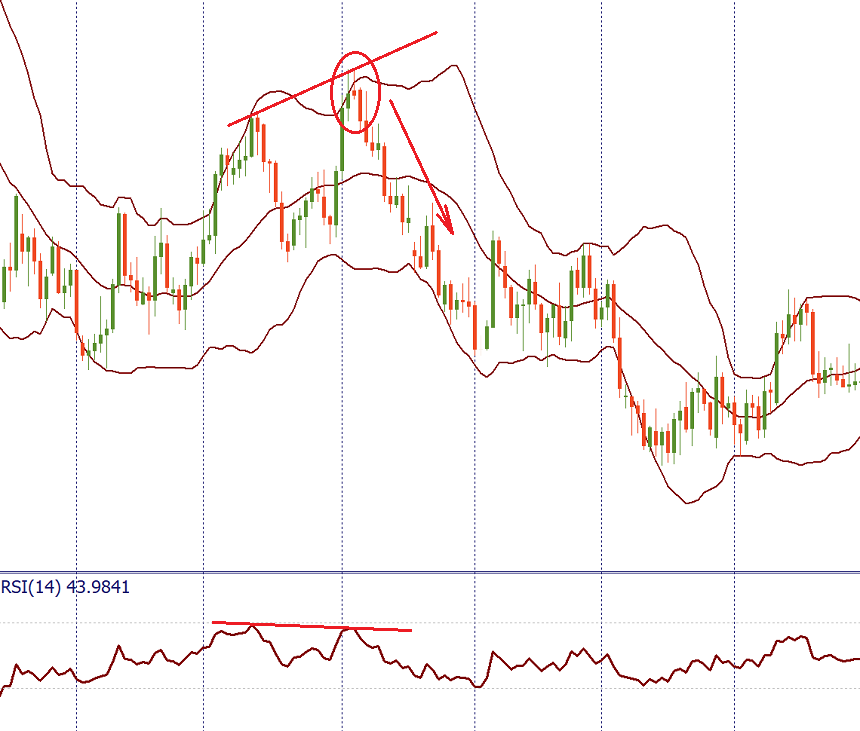
The picture above shows that the reversal down from the upper BB is confirmed by the bearish candlestick pattern (evening start) and the bearish divergence between RSI and the price chart.
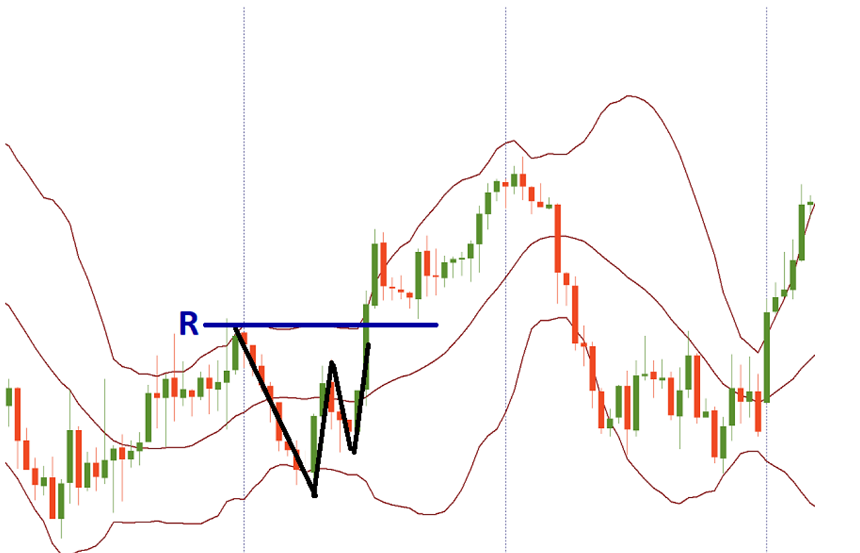
Near the outer Bollinger bands, there are examples of a particular sort of price action. A W-bottom can form in a downtrend and involves two reaction lows. The second low should be lower than the first one and hold above the lower band. M-top is the opposite of a W-bottom. In its most basic form, it is similar to a double top. However, the reaction highs are not always equal. The first high can be higher or lower than the second one. The use of Bollinger Bands for ‘M’ and ‘W’ signals looks to provide earlier indications than those produced by the conventional ‘M’ and ‘W’ chart patterns.
Trading a pullback and a crossing of from the middle line
The center line acts as a dynamic support / resistance. If the price crosses the average BB, it signals a change in trend. Be sure to look for confirmations in such cases.
Notice that the price often tests levels beyond the mid-line before turning around, and those false breaks that can confuse traders.
If the price deviates from the bottom bar and crosses the middle line up, the top bar will be the upper price target. In a strong uptrend, prices usually fluctuate between the upper and middle bands. As a result, in a strong uptrend, consider looking for mid-range buying opportunities. If the upward trend is not so strong, the adjustments may be deeper and reach the lower BB. In a strong downtrend, look for opportunities to sell on average BB. If the downward trend is not so strong, a redirect may lead to a price upside of BB.
Conclusion
The Bollinger bands indicator is a very useful technical tool that can form a solid foundation for a very good trading system. It provides dynamic support and resistance levels and visualizes the level of volatility. Take your time to master this tool!
ADX indicator
The average direction index, or ADX, is the trend strength indicator. Trend traders want to find a strong trend and open positions in its direction. ADX helps to gauge how strong the trend is.
The indicator is based on the average of the extension of the price range over a period of time.
How to apply the average direction index
You can add an ADX to a chart by clicking “Insert” – “Indicators” – “Trend”, and then select “Average Directional Movement Index”.
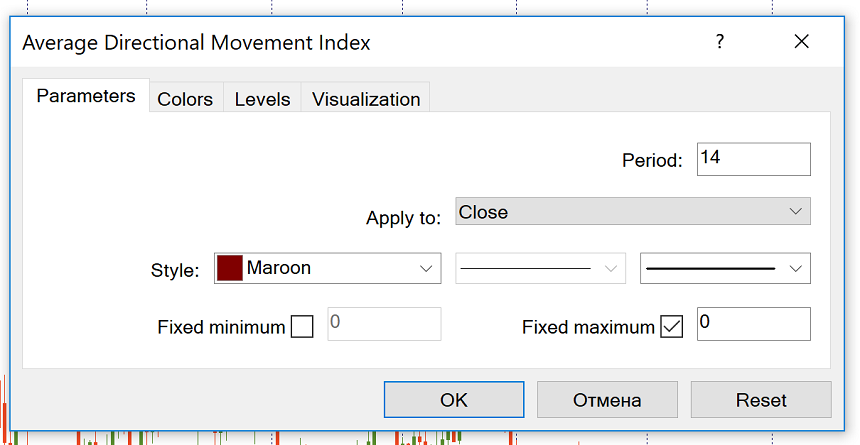
By default, the number of periods is set at ‘14’. You can change this number if you want to.
How to trade using ADX indicator
The MT4 indicator automatically includes 3 lines:
Medium Directionality Index (ADX) itself (thick brown line). Its values range from 0 to 100. This line registers the strength of the trend but does not indicate its direction.
Plus Directional Motion Indicator (+ DMI) (green line) is the difference between two consecutive highs.
The minus directional motion indicator (-DMI) (red line) is the difference between two consecutive lows.
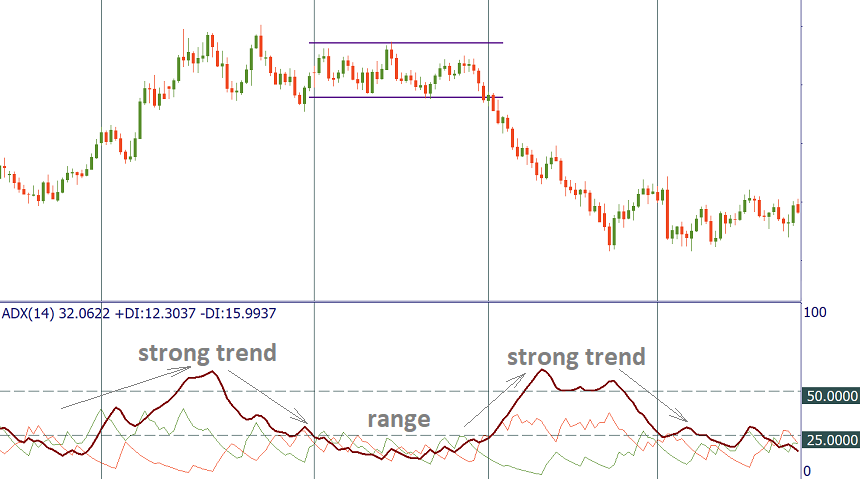
The ADX line is used to determine whether an asset is trending or not. There is a strong trend when ADX is over 25, so it makes sense to use trend trading strategies. Therefore, when the ADX is below 25, it is better to avoid trend trading and choose the right trading strategy. At such times the price goes into range. It should be noted that ADX can be used to validate a range break. When the ADX rises from below 25 to above 25, it means that the price is strong enough to continue in the breakthrough direction.
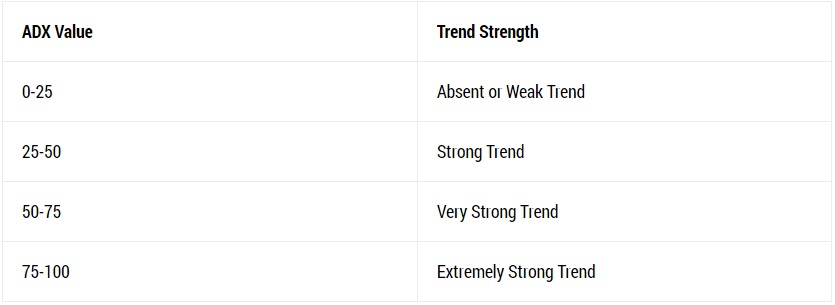
ADX value
There are more degrees of ADX value. You can check them in the table below:
In general, as the ADX line increases, the strength of the trend increases and the price moves in the direction of the trend. When the line goes down, the strength of the trend decreases and the price goes through correction or consolidation. Note that the ADX drop line does not mean that the trend is returning. It simply means that the current trend is weakening.
In addition, if you look at the ADX series of peaks, you will get information about the inertia of the trend. If there are a series of higher ADX peaks, the trend increases. This will allow the trader to know that he / she can keep the trends open while letting the profits flow. A series of lower ADX peaks means the trend is declining. Keep in mind that, despite the downturn, the trend may continue. However, in this case, the trader should be more attentive and selective about the new entry alerts. It may be wise to tighten the suspensions on existing positions or consider partial gains.
Classic ADX signals
+ DMI and -DMI determine the direction of travel. Generally bulls predominate when + DMI is greater than – DMI, while bears have an edge when -DMI is larger. The + DMI and -DMI crosses make a trading system in combination with ADX.
The “Buy” signal appears when + DMI crosses above -DMI (ADX should be above 25). Stop loss is usually placed at the bottom of the signal day. The buy signal remains in effect as long as this low holds even if + DMI crosses back from below – DMI.
Conversely, a “sell” signal occurs when -DMI crosses above + DMI (ADX should be above 25). The tip of the signal day becomes the initial stop loss.
Conclusion
For trend traders, the Average Directional Index can be a very useful tool. It is recommended to use ADX in combination with price action analysis and other technical indicators.
Parabolic SAR
Parabolic SAR is a powerful tool that helps you analyze trends. SAR stands for Stop and Back. This means that the indicator can not only determine the trend, but also signal when it is time to close the trend trade and look in the opposite direction. The indicator was developed by J. Welles Wilder, who is also known for creating tools such as ATR and RSI.
How to implement SAR
Parabolic SAR is included in the MetaTrader default set. You can add it to the chart by clicking “Insert” – “Indicators” – “Oscillators” and then select “Parabolic SAR”.
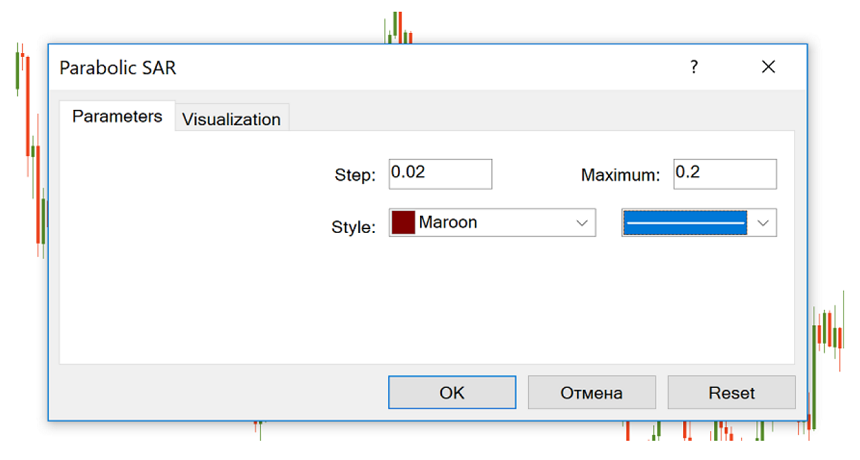
The indicator has 2 parameters that you need to set: “step” and “maximum”. Their default values are 0.02 and 0.2. Step is the magnitude of the acceleration. The acceleration coefficient starts with this value and then increases with the step size with each new maximum (or low for a downward trend) to the value determined by the maximum parameter.
You can start with the default parameters of the indicator and then adjust them to the asset you are trading with, the time frames you use and your trading style. Depending on your choice, the indicator may be more or less price sensitive. The higher the acceleration factor, the closer it will go to price. However, you should not set it too high as there will be too many reversals in this case. Wilder recommends not setting a maximum above 0.22.
How to interpret a parabolic SAR indicator
Parabolic is very easy to use. Makes points that determine the trend. When the points are below the price, the trend is bullish, while the points are above the bearish trend.
When the trend changes direction, the parabolic signal gives an input signal. It signals a bearish turn when it crosses the price upwards and forms 3 descending points above the candlesticks.
The parabolic signals whip when it crosses the price to the back and forms 3 ascending points below the candles.
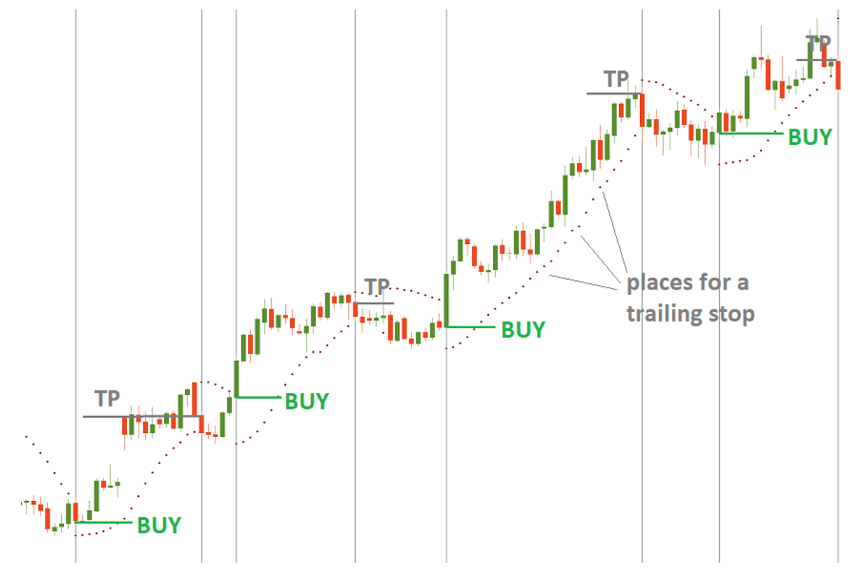
The indicator offers great help in determining the starting points. The solution is simple: close a buy deal when SAR comes back above the price and close a sell deal when Parabolic returns below price. This way, you keep open positions only in the direction of movement of the indicator.
In addition, the Parabolic SAR provides a framework for subsequent stops. In an uptrend, the indicator will rise after rising prices. Move your Stop Loss order from one point to the next to limit the risks and block the profit.
Conclusion
Parabolic SAR is a powerful and unique indicator. It works best in a trendy market with long rallies and downturns. In the foreign market, however, there is a high risk of receiving false alerts.
SAR will work well in combination with other technical indicators such as ADX. If the ADX confirms a strong trend, then you will be able to use the parabolic SAR with greater confidence.
Alligator
Alligator is an indicator developed by Bill Williams. Its purpose is to identify a trend and its direction and filter good signals from the bad ones thus avoiding the range-bound market that can lead to loses.
Construction of Alligator indicator
The indicator consists of 3 moving averages which are offset towards the future:
- Alligator’s Jaw (the blue line) – 13-period smoothed moving average which is moved 8 bars into the future.
- Alligator’s Teeth (the red line) – 8-period smoothed moving average which is moved 5 bars into the future.
- Alligator’s Lips (the green line) – 5-period smoothed moving average which is moved 3 bars into the future.
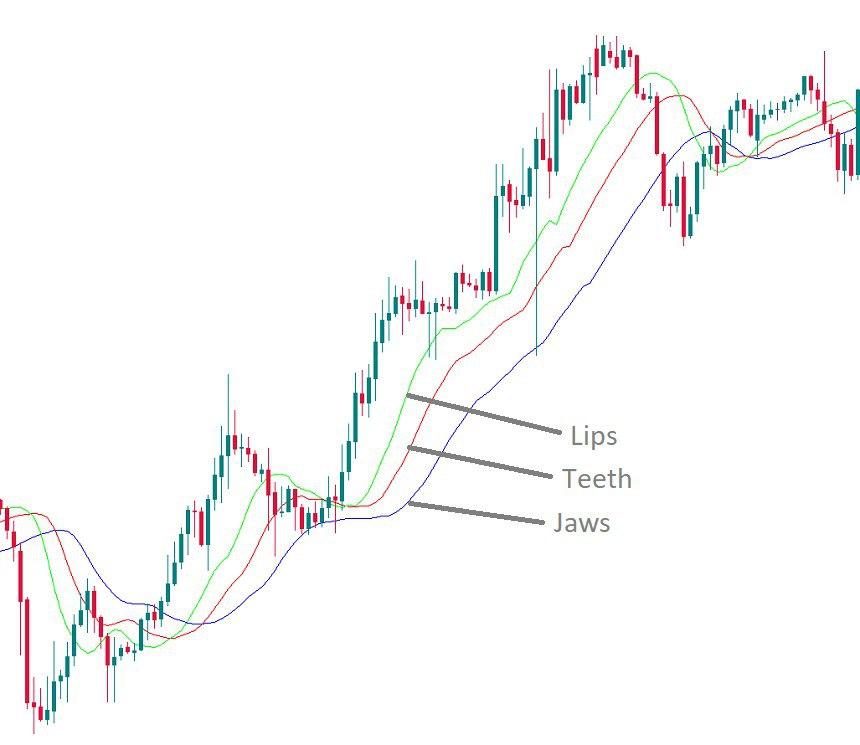
Bill Williams refers to these moving averages as “balance lines”. You can see that he also gave creative names to the indicator and its elements. His idea was to provide an example that will demonstrate the behavior of the market. This example is an alligator that alternates between periods of sleep and hunting.
How to interpret Alligator indicator
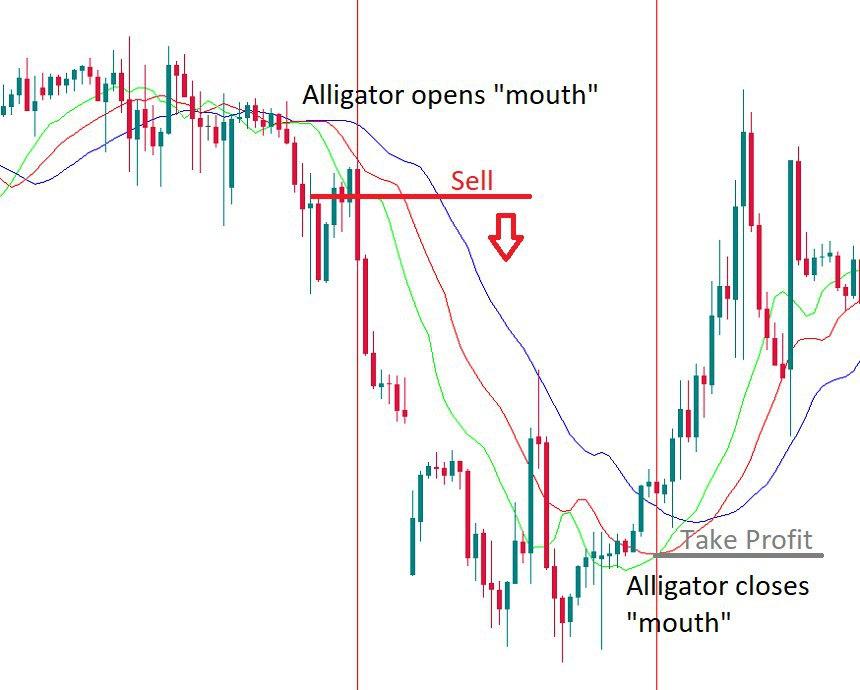
When the Jaw, the Teeth, and the Lips are intertwined, it means the Alligator is asleep and there’s no uptrend or downtrend at the market. Bill Williams recommends staying out of the market during such periods. The longer the Alligator sleeps, the hungrier it wakes. When it wakes up from a long sleep, it opens its mouth (moving averages diverge) and gets ready to take a big bite of the market. It’s time to trade! The Alligator will drive the price away and offer a decent profit to a trader. Having eaten enough, the Alligator goes back to sleep (moving averages converge), so it’s time to take profit.
If the alligator is not sleeping, the market is either in an upward trend or in a downward trend.
- If the price is above the alligator’s mouth, this is an upward trend. The indicator lines take the bullish order (green on top, then red, then blue).
- If the price is below the mouth of the alligator, this is a downward trend. The alligator lines accept a bearish line (blue at the top, then red, then green).
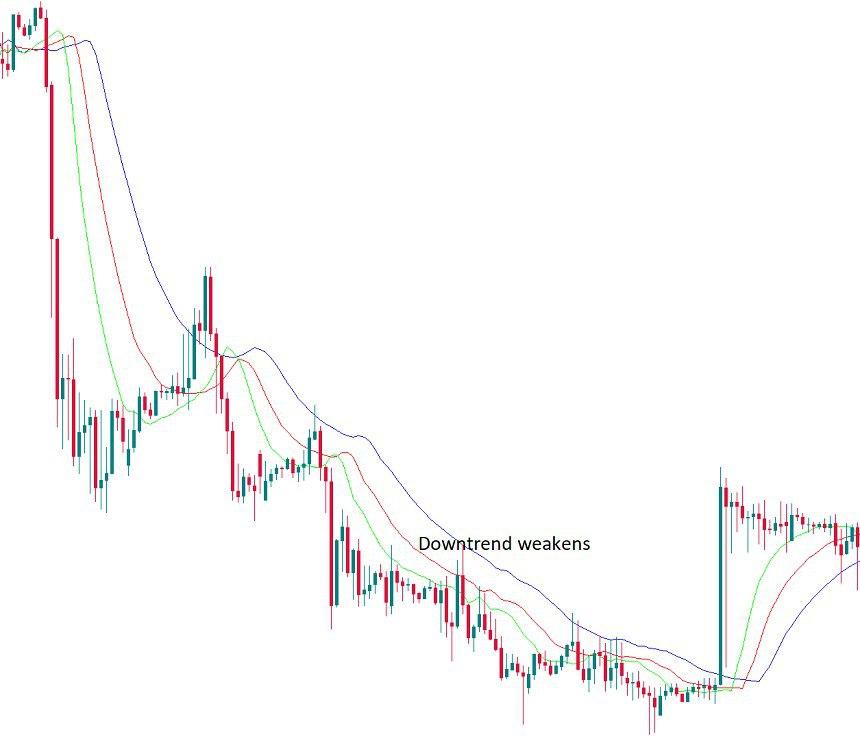
Balance lines can provide support/resistance during the trend phase. The price may exceed the green line for short periods of time. The more he tries to break through the green line, the weaker the trend becomes.
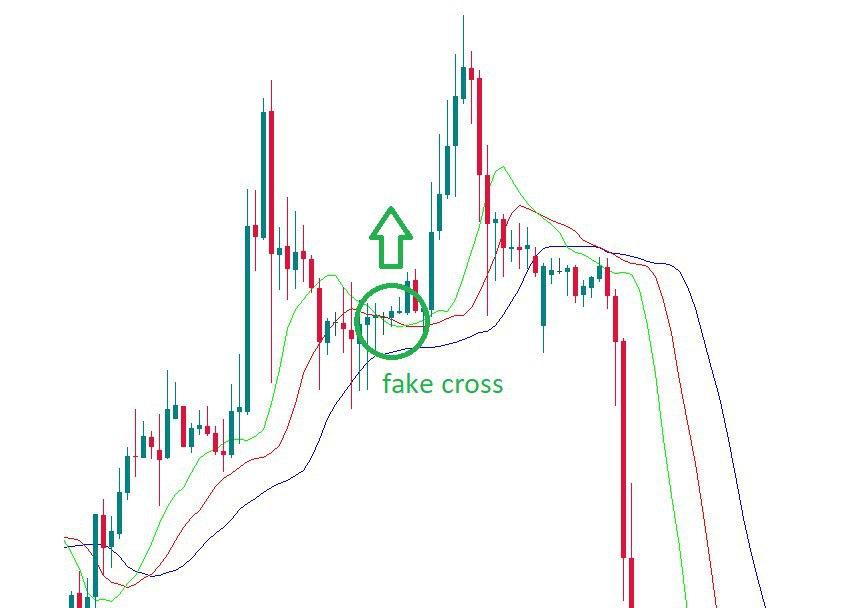
It’s also possible to look for the so-called “fake crosses” or the situations when the green line crosses the red line but then turns back. If such cross happened during an uptrend, you can buy once the green line returns above the red one.
Combining an alligator with other instruments
There may be many different combinations between Alligator and other technical analysis tools. Here are some suggestions.
- Look for a reverse model (chart model or candlestick model). Once you have it, use the Alligator to confirm (i.e. wait for the green line to cross other lines).
- Use Alligator with Fractals. Wait for the moment the alligator sleeps (the balance lines are intertwined). Place an order to stop a purchase with 1 pips above the latest fractal up, which is above the alligator’s mouth.
Conclusion
The Alligator indicator has a unique formula that sets it apart from a simple set of moving averages. Based on moving averages, the indicator responds to price changes with a delay. At the same time, it can be used to select the beginning of a new trend, as well as the moment when the trend resumes after correction. The alligator is a ready-to-use trading system that can be accompanied by other analytical tools for greater precision in trading. When using Alligator, check several chart timelines.
Disclaimer: The publications on this platform aim to provide useful information on financial topics. But they are NOT financial consultation or advice. Therefore they should not be used as a recommendation for making an investment decision on any type of financial products and services. We use in-depth research in the field but do not guarantee the completeness of the published materials. Always consult a specialist in your particular situation. "Applications In Life" Foundation is not responsible for any adverse consequences resulting from actions taken based on the information provided on the platform.