
This publication aims to help fulfil the mission of “Applications In Life” Fondation to support and develop accessible and understandable financial education by improving financial culture and forward-thinking mentality of the civil society.
In the 1930s, Ralph Nelson Elliot discovered a revolutionary theory (The Wave Principle – 1938), which to this day remains one of the most professional methods for forecasting financial markets. Elliott’s theory wins many adherents because it turns out that wave patterns describe the structure of market movements very well. This theory provides much greater opportunities for good forecasting of market movements, including for a longer time ahead. Over the years, followers of the theory have supplemented his work, but virtually all known market models were described in the basic theory by Elliott himself, more than 70 years ago. Robert Pretcher, Glenn Neely, and many others introduced many rules for performing wave analysis.
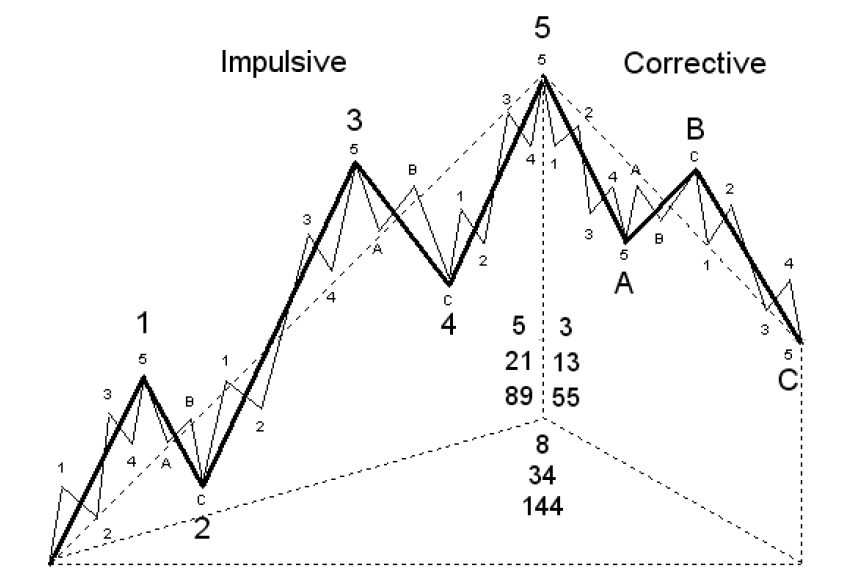
After extensive research on the charts of price movements, Elliott found that financial markets move according to certain models. These patterns are repeated continuously on larger scales (years, decades) and on smaller ones (months, days, etc.). The smaller price figures are grouped in a certain sequence and thus form a larger model, which in turn always tends to a basic base model. In general, it is expressed in the following – each cycle of price movements is expressed in the same way – with five waves, three of which are in the main direction of the trend (1,3,5), separated by two waves against the main trend (2,4), followed by some three-wave combination (A, B, C), which is in the opposite direction. Elliott calls the five wave structures in the direction of the trend “pulse” and designates them with numbers 1, 2, 3, 4, 5, and calls the opposite waves “corrective” and marks them with letters – a, b, c, etc. To clarify: a wave is called a clearly distinguishable movement in price from bottom to top or from top to bottom. The phrase that prices in financial markets move in waves has been used since Charles Dow, who is considered the father of technical analysis (Charles Dow – named after him and the most famous stock index Dow Jones).
Metaphysical justification of waves.
It can be said that the basic model of Elliott is an idealized version of a market cycle. A market cycle is the period of time for which it is assumed that the actions of buyers (bulls) and sellers (bears) who trade in the same price-time frame are reflected in the price movement. Cycles are usually measured from bottom to new bottom, but can be detected cycle and between two peaks (especially in bearish trend). Usually the scenario in which market cycles unfold is approximately the same. Easier perceived when the market cycle begins and ends with a bottom, so most theorists explain the wave principle in such a scenario.
Wave 1 is formed by collecting profits from the previous trend. If point 0 is the bottom, then the previous trend was downward and closing short positions means purchases that lead to a rise in price. At the end of the first wave, a temporary peak is formed. This peak allows traders expecting a new price reduction to open new short positions at a better price. In the beginning, when the starting point is formed (point 0), no one knows that this price will remain unreached for a long time and it is assumed that the trend is more likely to continue. Then new sales start, which form wave 2.
Wave 2 is actually the main test and proof that a new uptrend has begun. The rule for wave 2 is that it must not touch the level of the beginning of the 1st wave. Otherwise, this will not be a second wave, but part of the previous downtrend. According to Glenn Neely (a wave theory follower who has spent more than 10 years of his life studying financial market waves), in most cases, a second wave is not a deep correction and does not exceed 61.8% of the first wavelength. The fact that the price failed to reach the previous bottom is a signal for market participants to start closing their short positions, as their expectations have not been met. In addition, traders in the short term have the opportunity to open long positions for the top of the 1st wave, and even above it. Thus, many purchase orders naturally accumulate after the end of the second wave. Hence the following rule for the 3rd wave.
The third wave is often the longest, but it can never be the shortest of the three pulse waves – 1, 3 and 5. Usually in this wave the potential for profit is greatest. The trend is strong, especially after crossing the top of the first wave – at this point all doubts about whether a new uptrend has begun are gone. One of the most common variants of pulse formation is with a third “extended” (see below) and in it the 3rd wave has a length of 1,618 to 2,236 (and even 2,618) from the length of the first, and usually 1 the 5th and 5th are approximately equal in length.
No matter how strong the third wave is, it also runs out and the participants start to take their profits (take profit). Thus begins the fourth wave. The fourth wave usually lasts a long time and irritates traders. The main incentive for market participants at this time is to wait for the end of the 4th and participate in the 5th wave, as they have great certainty in the direction and relatively in its length (and therefore potential for profits). There is one empirical rule for the fourth waves – as a minimum necessary condition to expect the end of the 4th wave, we must have a correction in the area of 50 – 62% of the third wave and the EWO indicator (analog of the MACD indicator) has reached the zero line. After fulfilling these conditions, the beginning of the fifth wave can be expected.
When the correction in the fourth wave is completed, the fifth wave begins. Regarding the fifth waves, there are different variants, according to their length and duration, which depend mostly on how the first and the third developed before. If the third wave was particularly long (more than 2 times larger than the 1st), then the fifth should be relatively weaker (it is possible not to exceed the top of the 3rd – the so-called: Failed 5th wave), and vice versa – if the 3rd wave is not very strong (from 1 to 1,618 from the 1st), then a strong fifth wave can be expected. In the second case, it can reach from 1.618 to 2.618 from the 3rd (or even from the length from point 0 to the top of the 3rd). With the fifth wave the whole movement of the trend is exhausted, after which a corrective movement in the opposite direction begins – A, B, C.
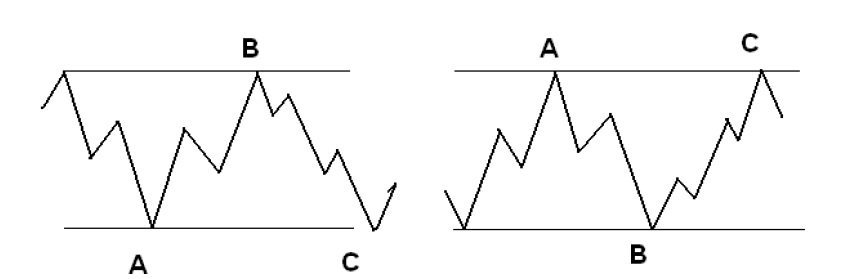
The correction of the main trend is a natural part of the market cycle during which prices try to recover at least part of the assumed price levels. In the general case, the correction tends to the range 0.5 – 0.618 of the entire movement during the pulse (from point 0 to the 5th wave). In practice, the adjustments can be several varieties, but in the basic model is embedded the so-called. “zig-zag”. In this model, it is interesting to mention that some market participants accept wave “B” as a renewal of the upward trend, as it develops in the direction of the main trend. However, the disappointment of not reaching the previous peak (in the 5th wave) soon followed and very often followed by strong sales in wave “C”. After the completion of the C-wave, the market is ready to start the next market cycle.
Application of wave analysis
Wave analysis is valid and applicable to all highly liquid financial markets – stock, currency or derivatives market. However, it should be borne in mind that the basic model, as described by Elliott, is open on stock exchanges and has specific features in different markets. If the model is considered for a long period of time (for example 10 years), it is assumed that the market will grow in the long run, because after the upward wave of the corrective does not bring prices to the starting point, but at higher levels. This conclusion may indeed be valid for the stock market because the increase reflects the increase in the value of the companies and the prices of their shares. But this principle is not valid for foreign exchange markets, for example. Because that would mean that one currency would become more expensive in the long run than the other – and this, of course, is not the case.
A good knowledge of Elliott wave patterns allows the trader to make the most of the trend. Until a figure is completed, the main direction of the price does not change. The guiding rule is to trade in the direction of impulse waves, as they provide higher profits, and during adjustments it is advisable to limit trading because the price often changes direction and movements do not have much potential for profit. Analysts with extensive experience in wave analysis seek to find the exact wave picture on the market and use it as a map on which the price moves. If the analysis is correct this can provide almost flawless trading. Even if you do not have extensive experience, the occupation of the wave analysis trader has many positive aspects. A good sense of the market is acquired and price movements become much clearer and more natural. Unlike the novice trader, who is often annoyed when the price enters a correction or is surprised by a strong movement in which he failed to participate. Knowledge of wave analysis instills in the trader patience and discipline to wait and enter the market at the most appropriate moments. Fibonacci relations are an essential part of wave analysis, and the analyst applies them much better to detect reversal points.
The first steps in applying this analysis are to mark the visible waves on the graph and search for familiar patterns. In principle, any clear peak or bottom reflects some wave of one time or another. It should be borne in mind that on short-term charts (less than 1 hour) the models are not always executed. Fractals (see Bill Williams TC) and the ZigZag indicator for detecting individual waves can initially be used as aids. More suitable for this purpose are fractals, which allow additional adjustment for the forming period – with a larger number of bars (the classic fractal is 5 bar). The modern wlxFractals indicator provides such an opportunity.
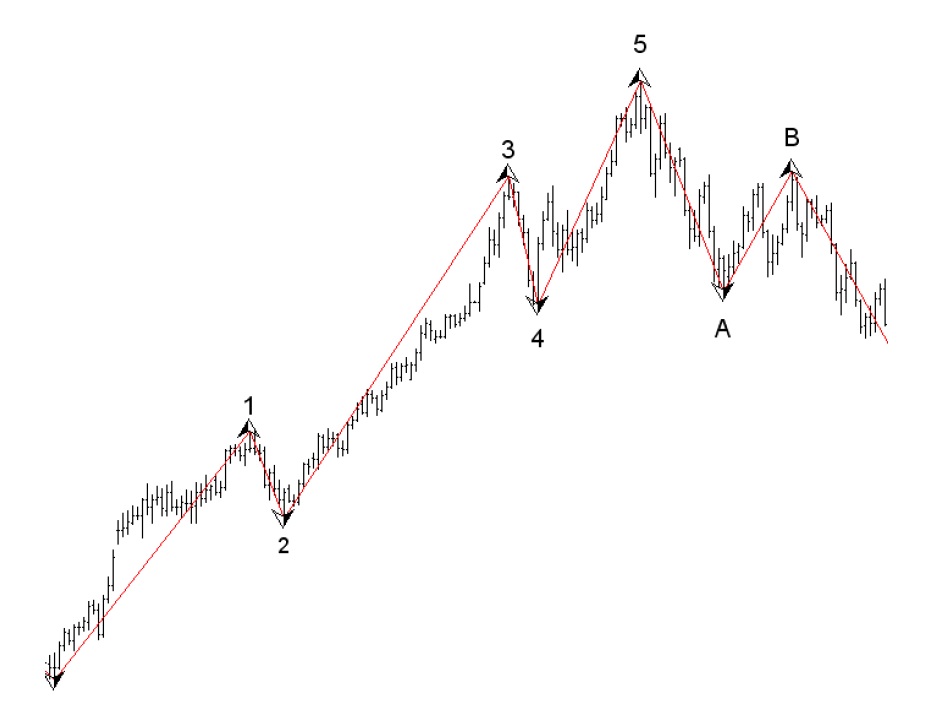
In the figure, fractals are set to be marked at eight bars before and after the extreme point. In this way, the important and significant waves of the price chart stand out.
General appearance of the waves
Impulses
Pulses are divided into two main types – Trend and Terminal.
Trend impulses are strong movements. Through these models, prices move to new levels. Generally speaking, in the graph they look like a trend consisting of five segments – three of them are in the main direction, separated by two opposing waves or figures (usually the corrections are longer in time and more complex than the pulse waves). .
Basic rules for impulse trend waves:
- a) The 2nd wave should never touch the beginning of the 1st.
- b) The 3rd wave is never the shortest and in most cases will be the longest of the three pulse waves – 1st, 3rd, 5th.
- c) The 4th wave must not fall below the top of the 1st wave. This can happen when
Terminal impulse, but not with Trend.
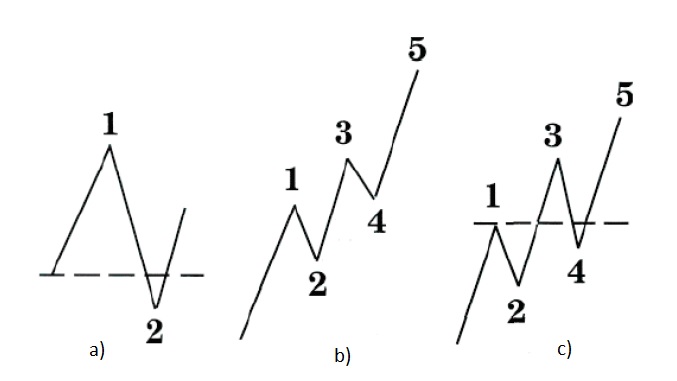
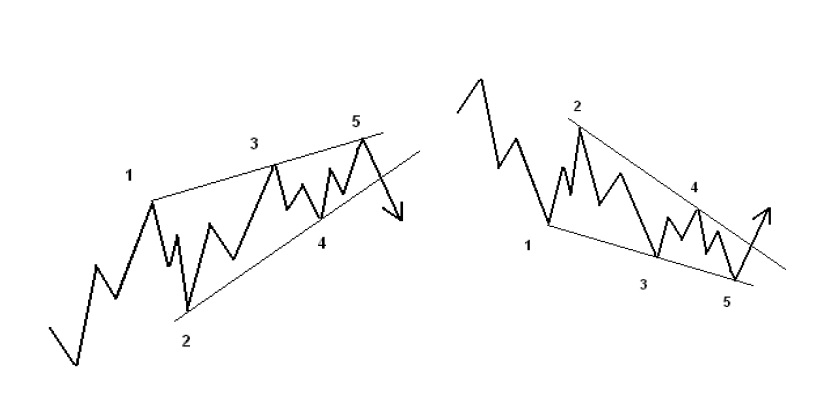
The figure shows examples of incorrect wave counting. In the first case, the basic rule is not followed – the 2nd wave should never touch the beginning of the 1st. In the second case, the rule for the third wave is violated – the 3rd wave is never the shortest and in most cases will be the longest of the three pulse waves – 1st, 3rd, 5th. In the third, the rule for the 4th wave is not complied with – it should not overlap the second.
One of the pulse waves is extended (extended) – 1st, 3rd or 5th. Normally, the extended wave must be 1,618 or more in length than the next largest pulse wave (there are exceptions to this rule). According to which of the waves is extended, three main types of impulses are distinguished. The most common option is with a third extended.
Often, in a third extended, the third wave itself is most clearly segmented (with clearly distinguishable peaks and bottoms).
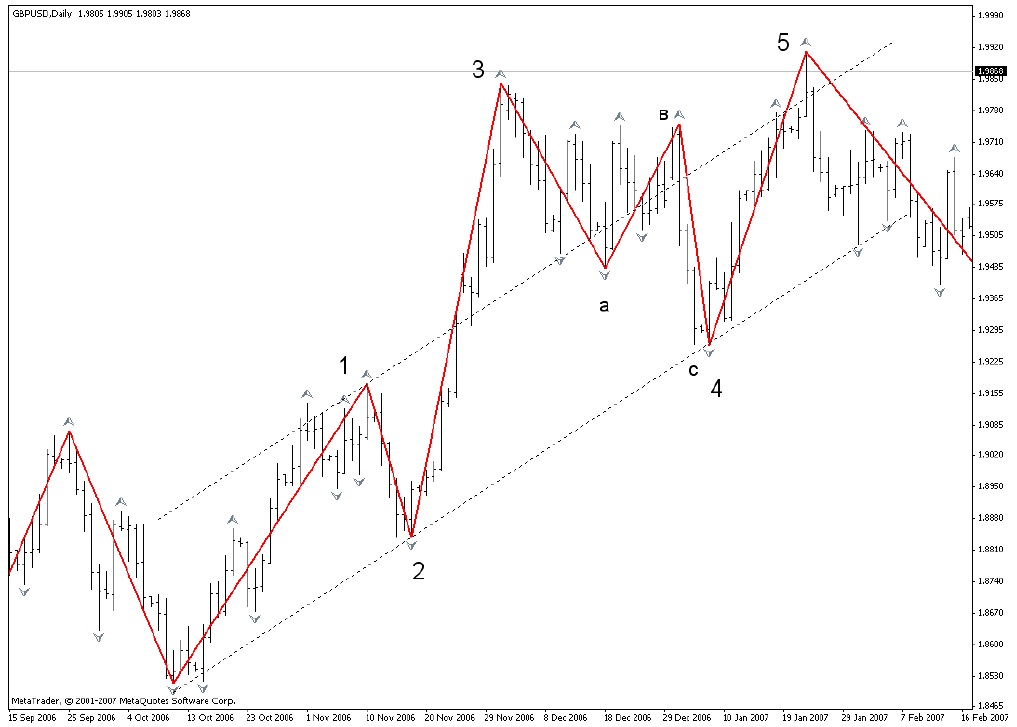
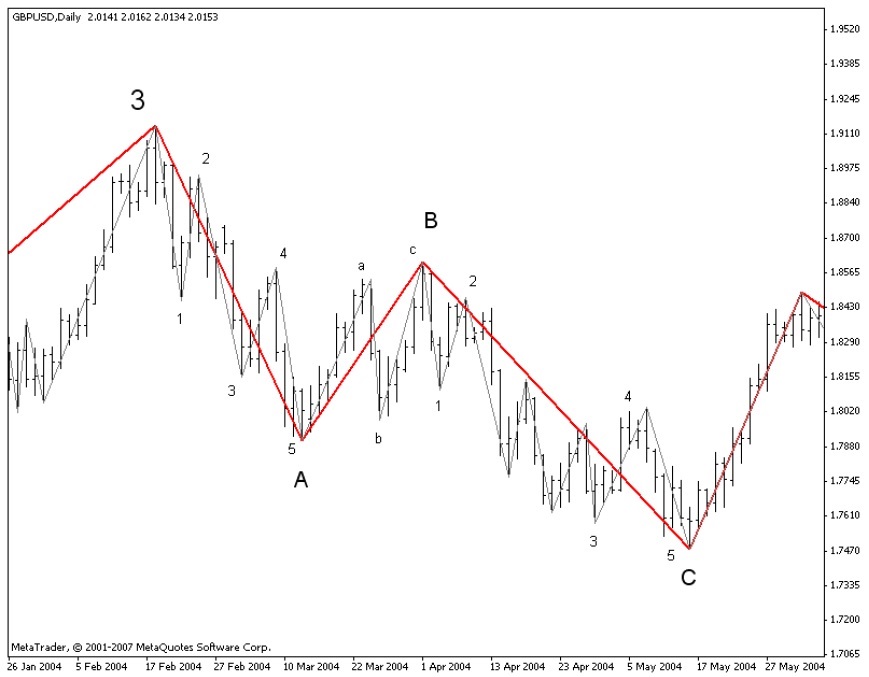
On the indicated chart (GBP / USD Daily chart) the basic conditions for trend impulse are met, with extended 3rd wave. The third wave in this case is 1,618 in length, compared to the first and fifth. When we have an impulse with extended 3rd, most often 1st and 5- they are usually equal in length or in a certain proportion (0.618 or 0.5). This can also be seen by constructing line 2-4 and parallel to it, passed through the top of the first wave.
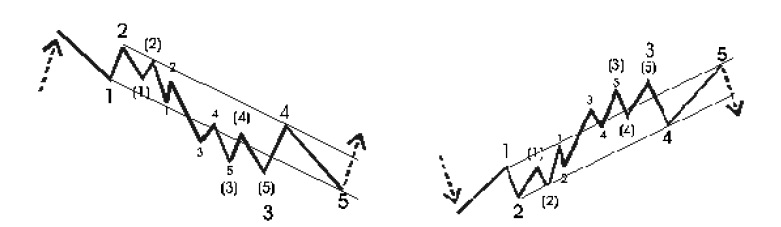
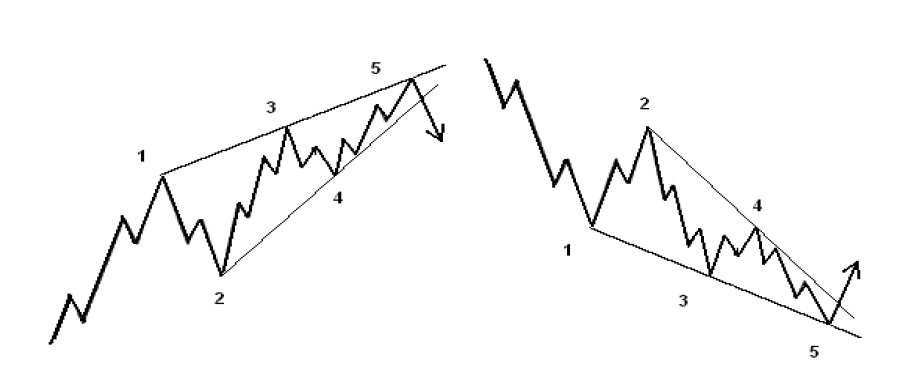
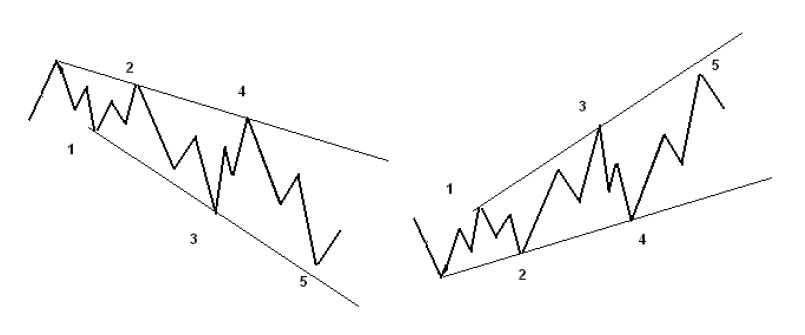
Diagonal triangle. These figures also represent a sequence of five waves, but unlike the standard pulse, the extended wave is not in the middle (3rd), but is the first or fifth wave. If segmented clearly (clearly distinguish the tops and bottoms), the internal structure can be with a structural series: 5: 3: 5: 3: 5, but can also be composed of triplets (: 3: 3: 3: 3: 3) . In the second case they are also called Terminals and most often these figures are obtained at the end of a larger construction in the form of a wave C in the corrections, or in the fifth wave in the pulses.
When the extended wave is first, the figure looks like a narrowing funnel.
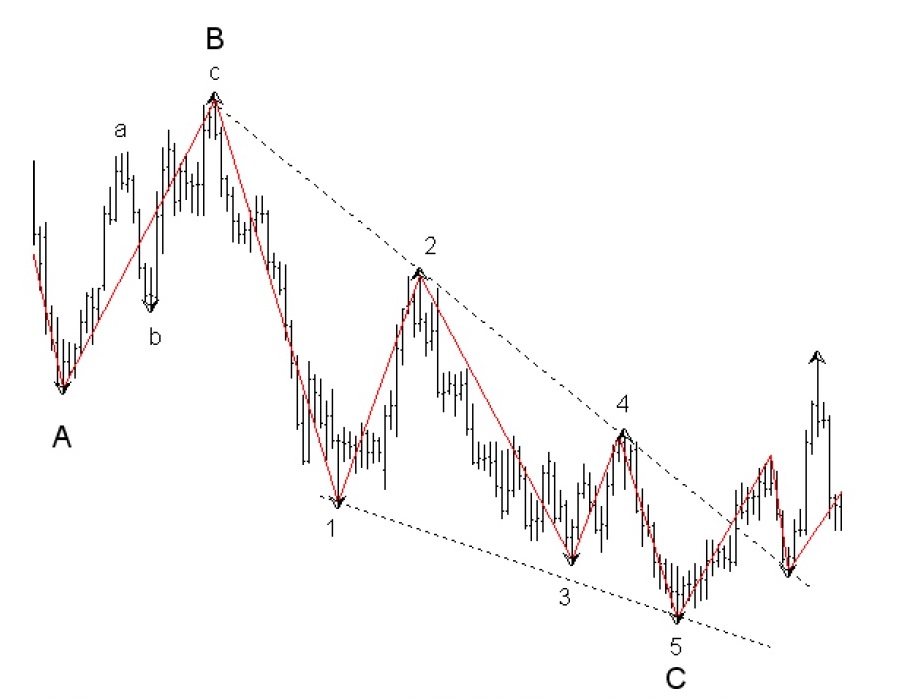
The figure shows a diagonal in the role of wave C. In this example, the internal structure of C is (: 5: 3: 5: 3: 5).
Terminals
The internal structure of these figures is composed of three wave combinations (: 3: 3: 3: 3: 3).
When the fifth wave is expanded, the structure looks like an expanding funnel.
Corrections
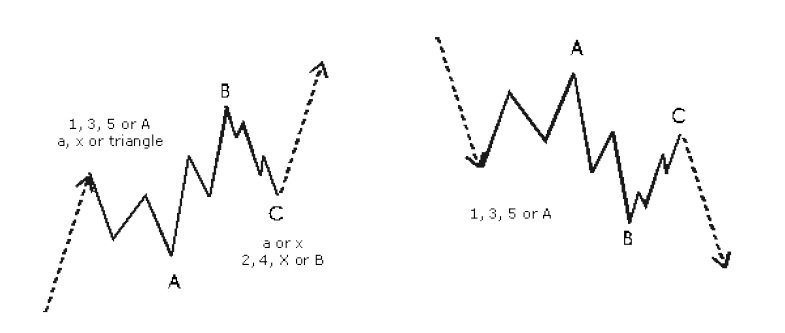
The corrections can be wave 2nd, 4th, A, B, C, D or E of a higher order. They are more complex structures than impulses and usually do not provide much potential for profit if they are not figures of a large time frame (daily, weekly chart, etc.). Good knowledge of them, however, gives an advantage to the trader, as the completion of the correction is the beginning of a new impulse movement, which can be played at the beginning and to achieve maximum profit. Varieties of corrective models are determined by the type of A-wave, the recoil in B-wave and the length of C-wave, relative to A and B. It should be noted that B-wave is quite often misleading, as it develops in the direction on the momentum and many traders open positions, expecting the trend to continue. Along the length of the B and C wave we can judge the strength of the next pulse wave. The stronger the B-wave and the weaker the C, the stronger the next pulse wave (3rd or 5th) will be.
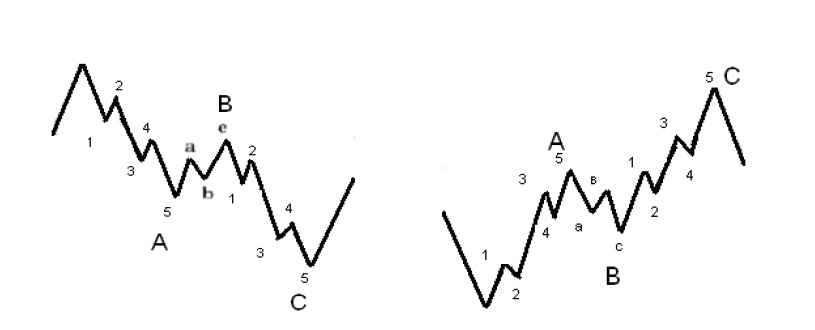
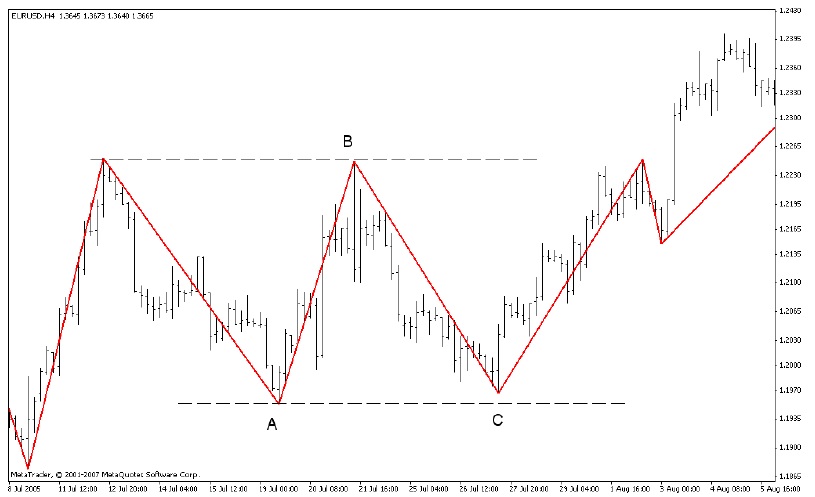
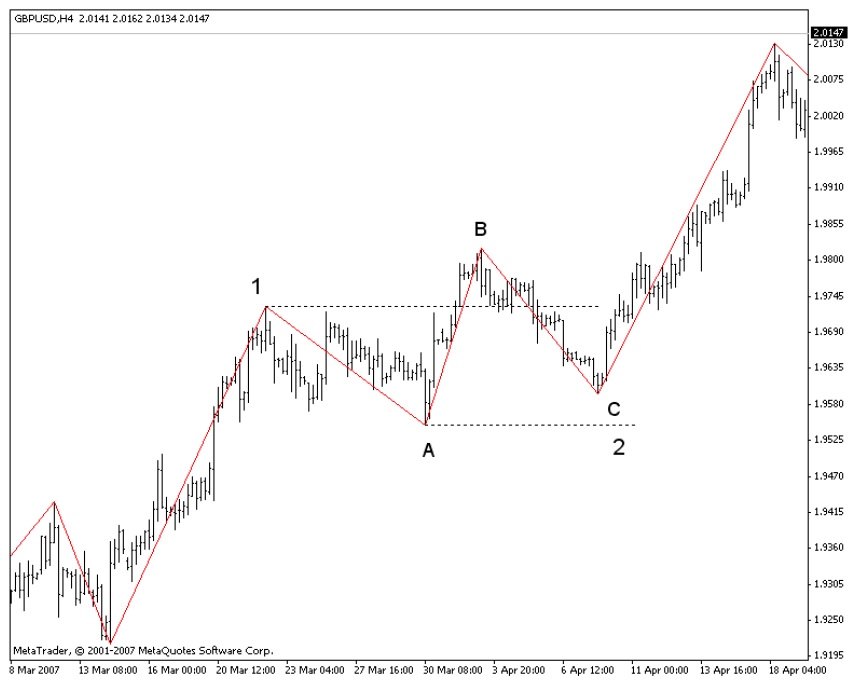
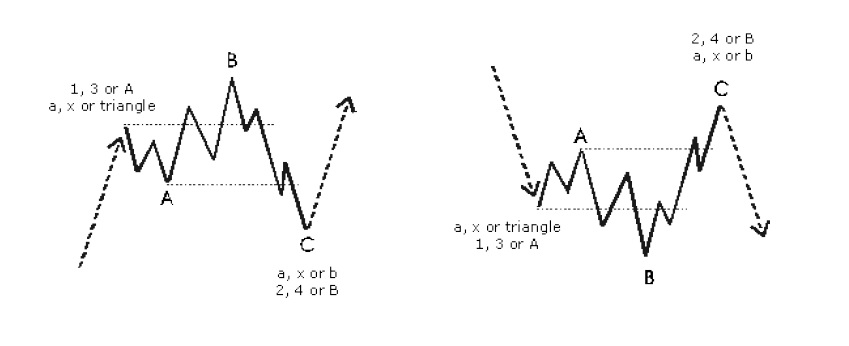
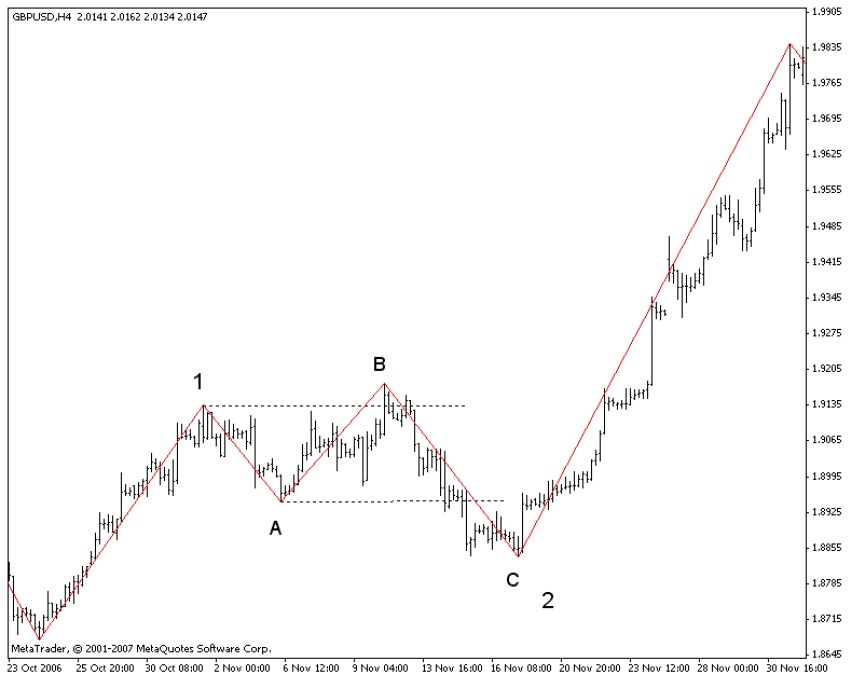
Zigzag (: 5: 3: 5) This type of corrective structure is accepted in the basic model of Elliott (correction A, B, C – Fig. 156). The model usually reflects a deep correction (for example 50% – 61.8%). If the A-wave is clearly segmented, then it must have a five-wave structure. It is followed by a B-wave with a three-wave structure, which usually does not end above 62% of the length of A. The end C-wave (with five waves: 5) is usually in some proportion to the length of A, most often equal to it, but may be 0.618 or 1.618 of A.
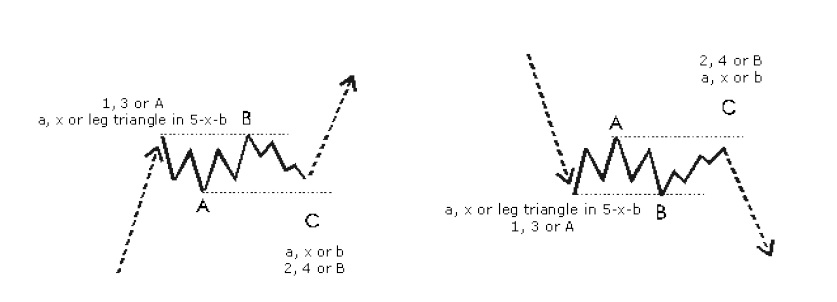
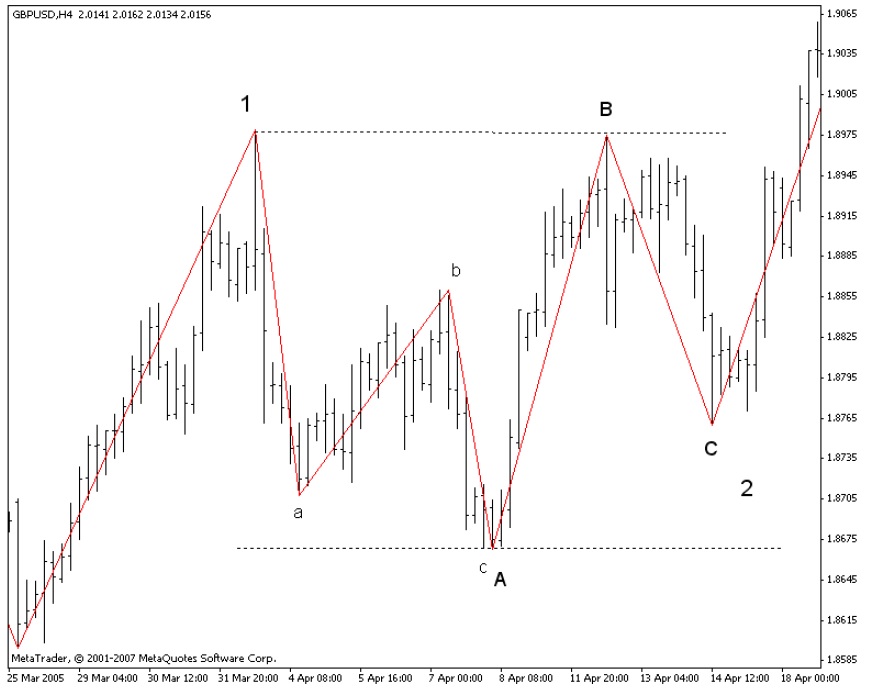
Flat (: 3: 3: 5) Unlike zigzags, in flat corrections the B-wave reaches the length of A (or at least 80% of A). Wave A has a three-wave structure. Hence the rule – when the correction starts, we follow what it will be A. If it is with five waves, we should expect a zigzag, if it is with three, then the whole correction will be some kind of flat or triangle. We have a classic flat correction when B reaches exactly the level of the beginning of A, and a C-wave reaches or slightly passes the bottom of A.
When B wave exceeds the length of A and the next wave C does not reach the bottom of A, then we have the so-called. moving or running correction (running). It is a sign of a strong trend and most likely the next pulse wave will be strong and long.
If a B-wave exceeds A and then a C-wave falls below the bottom of A, then we have an irregular correction. These figures look like expanding structures and usually after their completion the movement is not as great as in the running correction.
A stronger model is a flat with a failed C-wave. When C does not reach the end of A (for example 0.618 of A), this means that the strength of the next pulse wave will most likely be large.
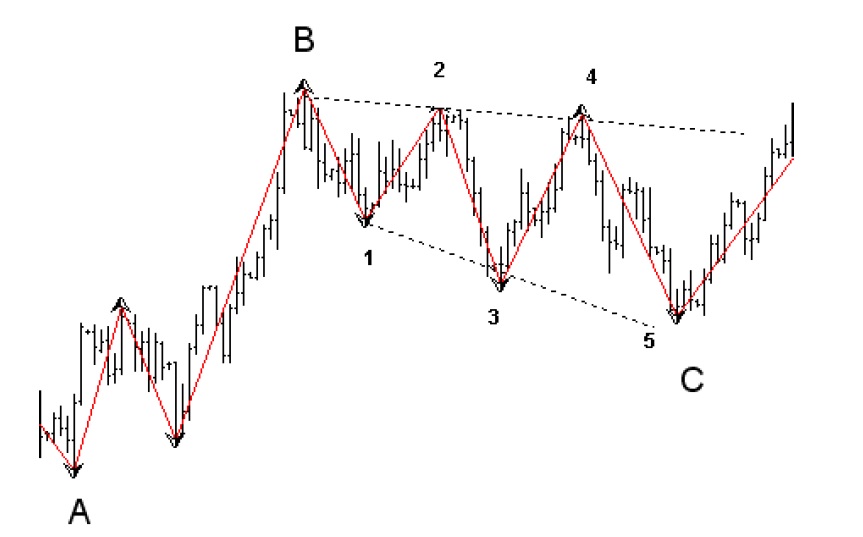
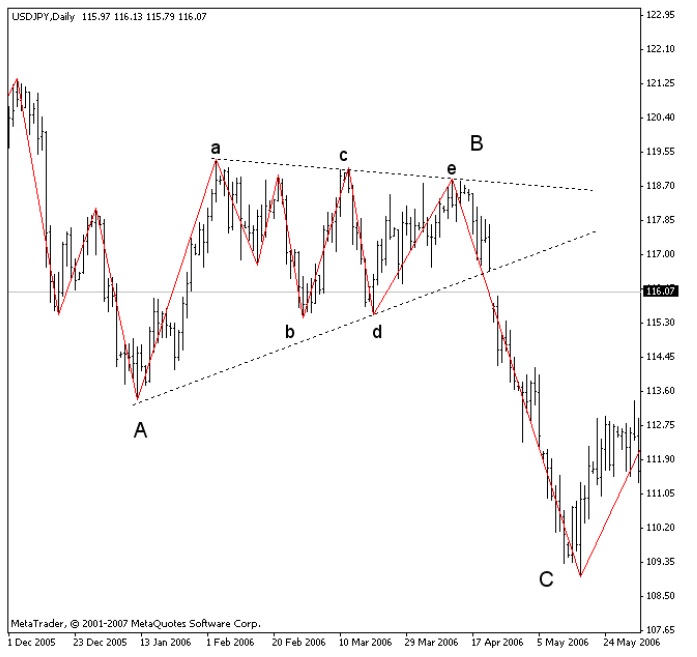
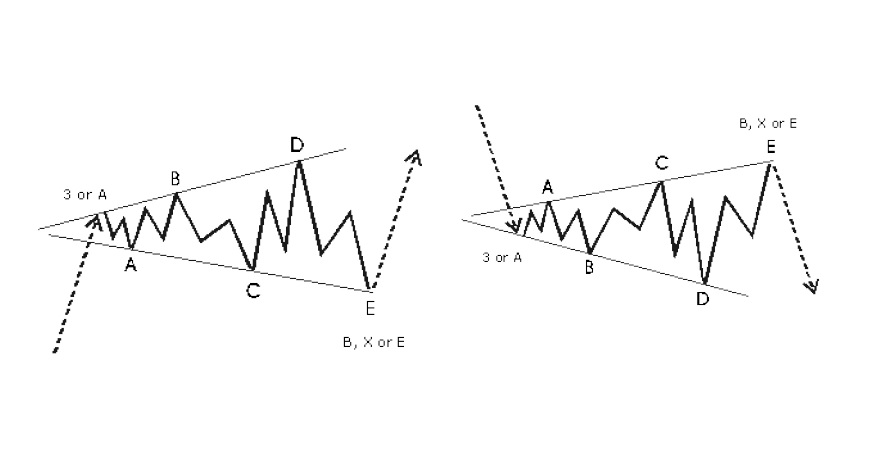
Triangles. (: 3: 3: 3: 3: 3) In the case of narrowing triangles, it is important to know that they are figures in which the market accumulates energy. Once the price goes beyond the outline of the triangle, a strong movement will follow. These figures are with high profit potential. If they are clearly segmented, the waves forming the triangle are triplets (: 3) – A, B, C, D, E. Most often the triangles are found in wave B or in the 4th.
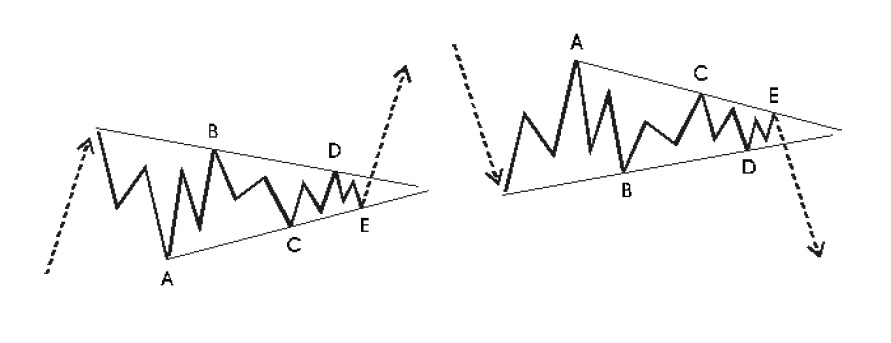
Expanding Triangles. Unlike the narrowing triangles, here the market loses energy.
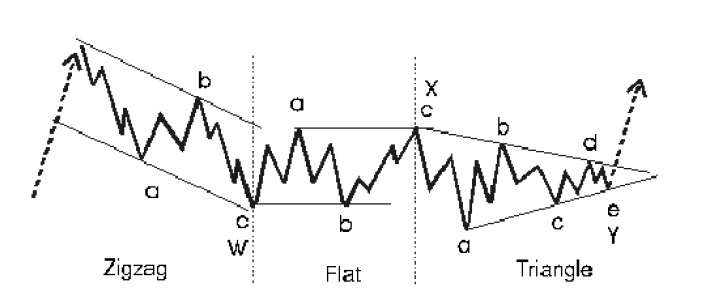
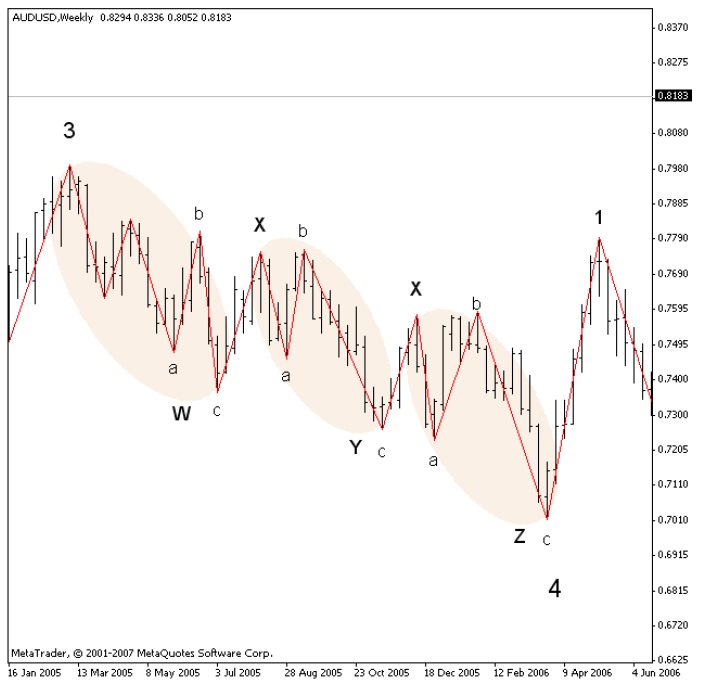
Complex adjustments – Combinations. Complex corrections are a series of several simple corrections (zigzag, flat or triangle) that are connected by an X-wave. The X-wave can be a correction of any kind. When we have combinations, for convenience, auxiliary symbols are used – W, X, Y, Z.
For many of those who are just entering wave analysis, it seems quite complicated. It is true, but still the figures are limited in number and can be studied.
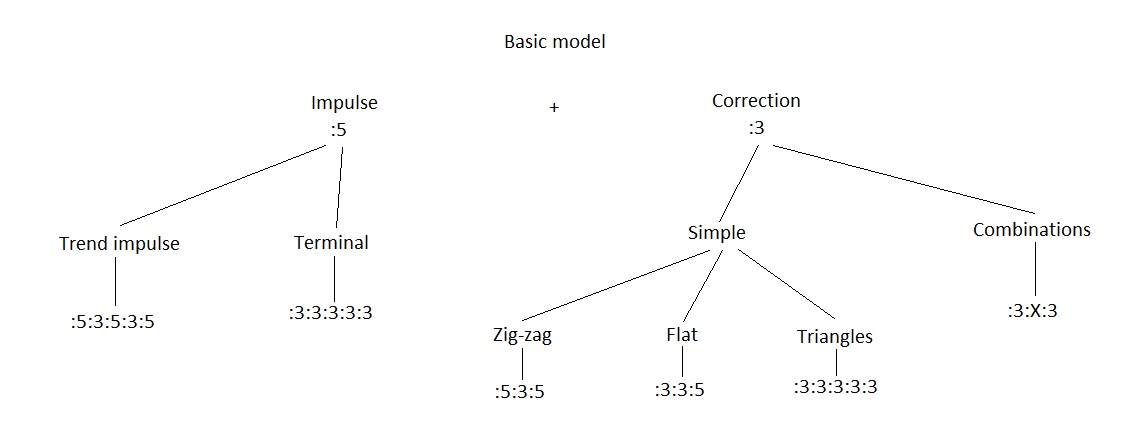
General scheme of possible wave structures.
From the above scheme we see that in fact the main structural series are 5 varieties plus the combinations with the “X” -waves. Each of them has its own specific characteristics such as: possible location in the larger wave picture, Fibonacci relations, internal energy and recoil force after the completion of the figure. The possible combinations and combinations with the main structural series can be very different, but they are still limited by the basic rules for their location in the larger wave picture.
Disclaimer: The publications on this platform aim to provide useful information on financial topics. But they are NOT financial consultation or advice. Therefore they should not be used as a recommendation for making an investment decision on any type of financial products and services. We use in-depth research in the field but do not guarantee the completeness of the published materials. Always consult a specialist in your particular situation. "Applications In Life" Foundation is not responsible for any adverse consequences resulting from actions taken based on the information provided on the platform.