
This publication aims to help fulfil the mission of “Applications In Life” Fondation to support and develop accessible and understandable financial education by improving financial culture and forward-thinking mentality of the civil society.
Proportional analysis refers to the length of price movements and is a mandatory part of the analysis of every analyst and trader. When trading, it is important to find not only the direction of the next movement, but also how far it will last. Otherwise, there is a possibility that we will not achieve the maximum possible profit or that we will have too high expectations and miss the right moment to go out. The techniques for detecting key levels are very different, but we will focus on the most famous ones.
More than a hundred years ago, stock exchange brokers discovered the rule of 1/3 or 2/3 retracement. They noticed that when the market moves strongly in one direction, usually the next movement in the opposite direction – the correction, stops at a distance of 1/3 or 2/3 of the length of the first movement. When analysts began to calculate these ratios more accurately, they found that the more correct ratios were 0.618 and 0.382, which represent the so-called “golden section”. Then they turn to the theories of the Italian mathematician Fibonacci and the golden section. In fact, the golden section has been used by the ancient Greeks, but in the financial markets relations are becoming popular as Fibonacci numbers and relations. Here we will not dwell on the theory in detail, although it is very interesting. We will only mention the most important, which is directly used in the analysis of financial markets.
The Fibonacci series.
This number sequence is formed as each subsequent number is a sum of the previous two:
1,2,3,5,8,13,21,34,55,89,144,233,377,610,987,1597,2584….
The interesting thing about this series is that the following regularities are constantly observed: if we choose any number from the series, it turns out that it refers to its neighbors in the ratio 0.618 and 1.618, and the larger the number, the more accurately they are fulfilled. these relationships. If we compare any number with its neighbors in one forward and backward of the series, it turns out that they relate in the ratio of 0.382 and 2.618; and in 2 numbers – in the ratio of 0.236 and 4.236.
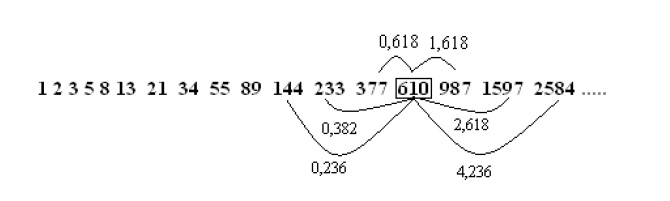
The lengths of price movements in the financial markets continuously fulfill any of the above relations.
How are Fibonacci levels measured and applied?
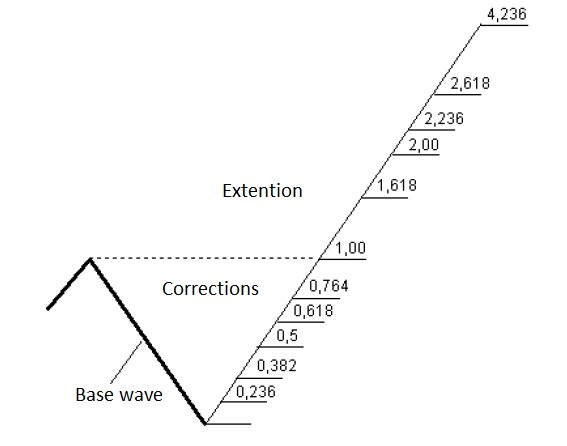
The most commonly used method for measuring and forecasting the length of the price movement is along the last wave, which ended in the opposite direction – the so-called. “Internal Fibo”. A price wave means a price movement from top to bottom or from bottom to top (this term is also used by Charles Dow and Elliott – see chapter “Wave analysis”). For example, when a descending wave ends and a new upward movement begins, we take the length of that wave as a unit and project the Fibonacci levels. These levels, on the one hand, represent goals for the next upward movement, and at the same time play the role of natural resistances or supports.
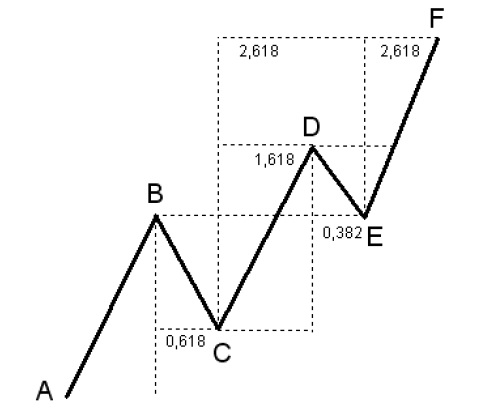
In this example, after the completion of the wave AB, it becomes a unit of measure for the projection of the next wave BC. The aircraft corrects 0.618 of the length of the AB. Subsequently, we take the aircraft wave as a unit to project the potential levels for point D. The CD wave is 1,618 in length relative to the aircraft. In addition, we design a level 2.618 from wave BC, which subsequently corresponds to point F. Wave DE makes a correction of 0.382 relative to CD, while the level of point E coincides with that of point B, reflecting the rule – broken resistance becomes support. From the wavelength DE we project target 2.618, which ends the next wave EF. As we can see, item F is predicted by two waves – as 2.618 * BC and as 2.618 * DE. When two or more Fibo-projections projected by different waves coincide, this level becomes a very probable reversal point. Properly designed Fibonacci levels act as a magnet for market prices and at the same time as reversal levels or at least temporary retention.
It should be borne in mind that when the price approaches the price targets there is a tolerance of 4-5%. For example, with a movement of 100 pips, the price may not reach or exceed the forecast level by 4-5 pips. If the price movement is of the order of 1000 pips, then 40 ÷ 50 pips are considered a good fulfillment of the price target.
Fibonacci Retracement
This guide is regularly used to predict the size of the waves, both corrective (against the main trend) and impulse (those that move prices in the direction of the main trend).
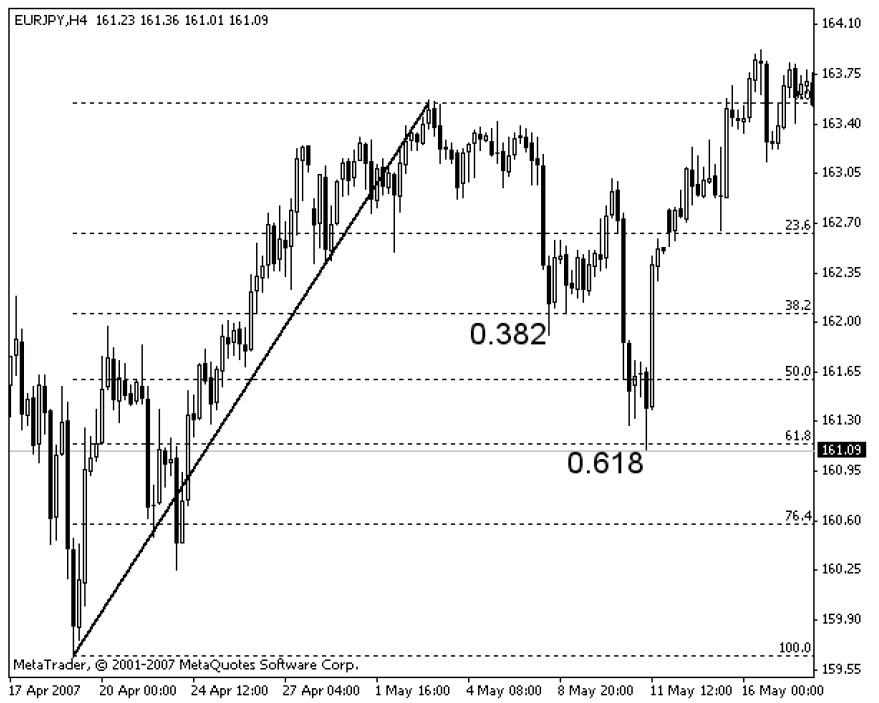
The above is an example of Retracement for the EUR / JPY currency pair. Between April 19 and May 3, the exchange rate registered a strong upward movement (marked by a solid line on the chart), which set a price point for the subsequent fall. When the downward movement begins, the exchange rate initially stops at the level of 0.382, relative to the previous upward wave, is repelled briefly, then reaches 0.618, where the price reverses and continues upwards. This case is a typical example of adjustments. These levels are used by traders as key levels where earnings or position opening orders are placed.
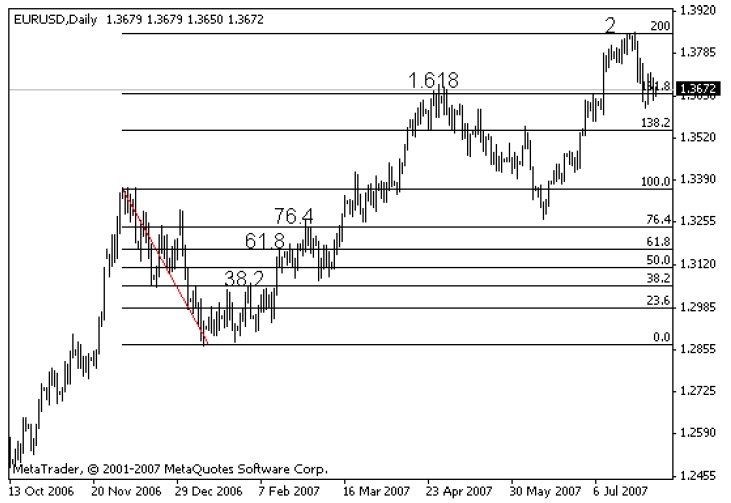
The levels we design in this way act, at least temporarily, as resistance or support and are used by traders to take profits. If one level is broken, the next one will most likely be reached. On the example given in EUR / USD on a daily chart, the downward wave sets the basis from which we project the next upward targets. On the rise, the exchange rate stops successively, albeit temporarily at 0.382 levels; 0.618; 0.764; 1,618 and 2. When one level is broken, the price goes to the next.
One way to mark Fibonacci levels is to use the Zig zag indicator, which is included in the main package of user indicators in the Meta Trader 4 platform. It marks each major wave in price movement, ignoring market noise.
There is also a Zigzag Fibo indicator – beta, which sets the Fibonacci levels, built automatically on the last zigzag.
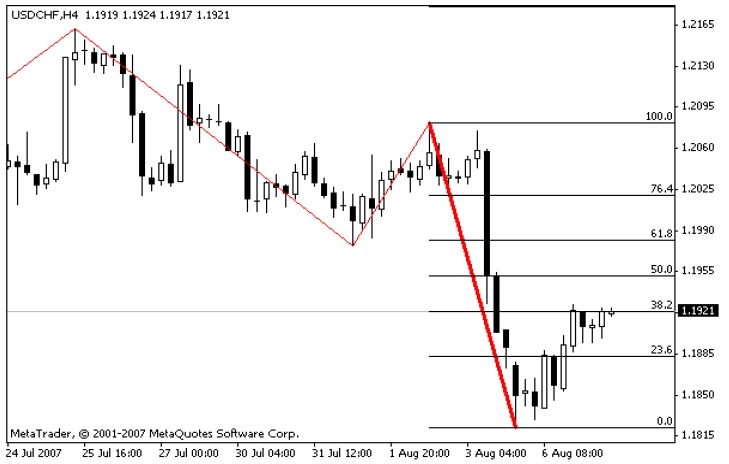
In the example of the currency pair USD / CHF on the 4-hour chart, the Zigzag Fibo-beta indicator builds our Fibonacci levels on the last downward wave. In the last rise we see how the price remains at 38.2%.
Fibonacci Fan
The Fibonacci fan is used analogously to retreatment – it is built on the basis of an important previous wave.
The Fibonacci fan is used analogously to retreatment – it is built on the basis of an important previous wave. Fan lines represent levels of resistance and support.
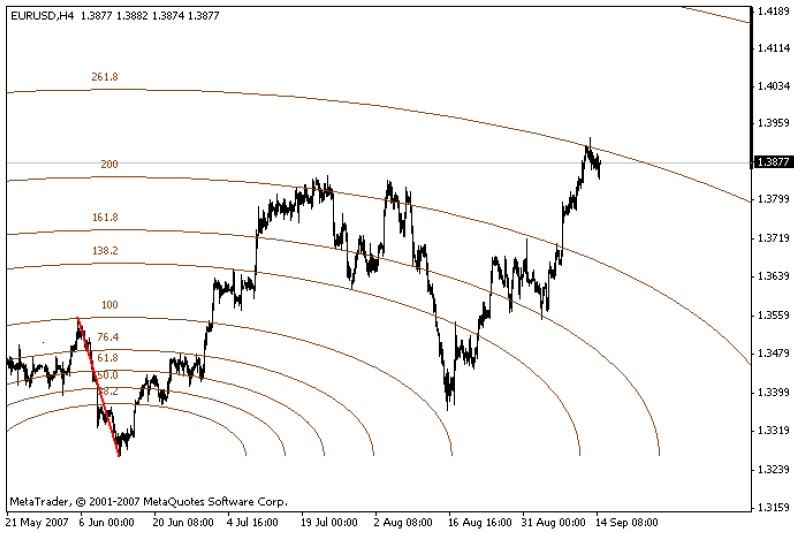
Fibonacci Arcs
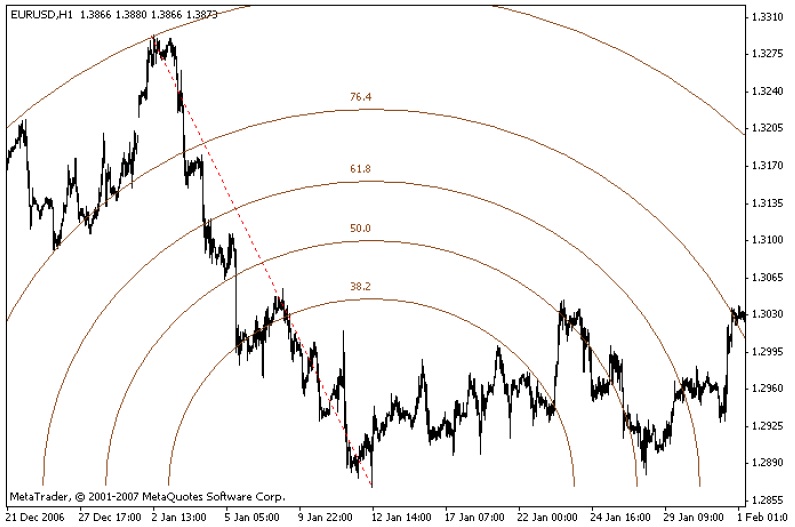
The use of Fibonacci arcs is analogous to fan and retraction, but arcs have the advantage of taking into account the time factor. It is especially appropriate to use the arcs when after a strong wave (for a short time a large price distance has been covered) a weak correction begins, which is expressed in a long time, but with little movement of the price.
Very often, however, arcs can act as valid price limits for longer periods of time if they are designed by an important wave.
Fibonacci Expansion
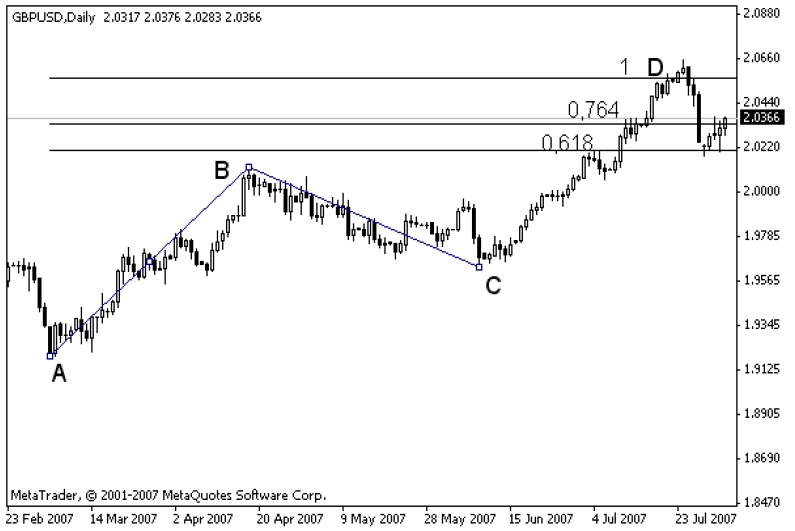
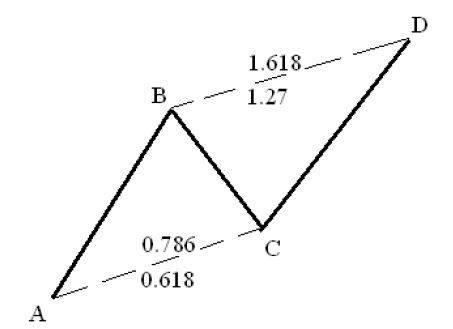
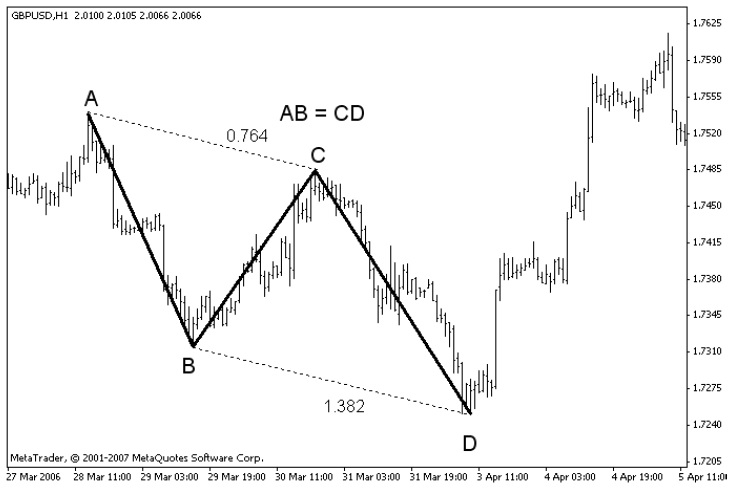
This method (Fibonacci extension) reflects the so-called. “External Fibo”. The design of price targets and price limits is derived from the last wave in the same direction as the current one. In the given example we take the wavelength AB as a unit and project this length from point C. This method is used when the current wave is expected to pass over the length of the last in the opposite direction – CD> BC. Very often when we have a strong pulse (AB) wave, followed by a correction (BC), then the next wave (CD) is in a certain ratio to the first pulse. For example CD = 0.618 or 1 or 1.618 of AB. This method is also known as the goals of Joe Di Napoli.
Fibonacci channels
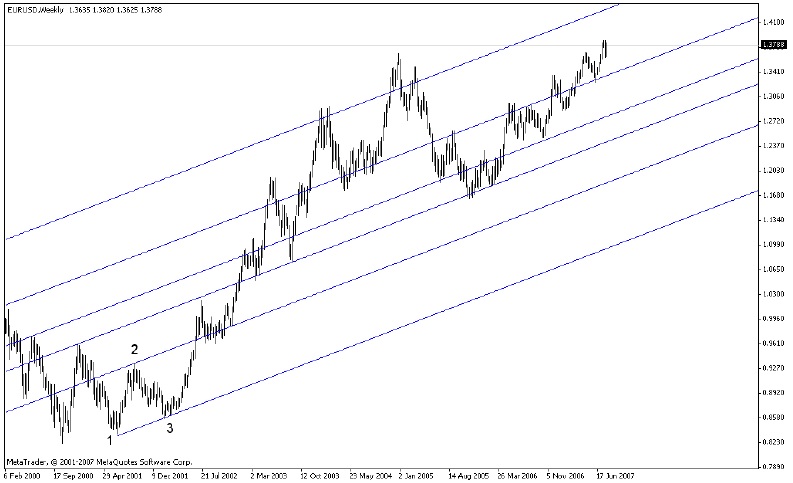
How are Fibonacci channels constructed? – in the first cycle in the direction of the new trend. The first cycle is bottom-up-bottom (1-2-3 on the chart) when we have an uptrend, or top-bottom-top with a downtrend. Fibonacci channels are valid lines of resistance and support. They reflect the principle that the trend does not develop evenly, but there are periods of acceleration and deceleration.
William Gann (1878-1955)
When we talk about proportional analysis, we cannot fail to mention one of the most successful traders in the financial markets, Dr. William Gunn. He is the author of one of the most interesting modern theories, combining price movements with time. Gunn uses many geometric and mathematical methods for forecasting. There are many of his followers and fans, but in practice his theories are very complex. We will focus only on the basic principles in its methods and will look at two tools that are embedded in the trading platform Meta Trader4. According to his theory, the optimal price movement develops at an angle of 45 degrees. It is assumed that the geometry of price movements and the angles at which market prices develop are specific and serve as a basis for predicting future movements.
Gunn’s fan
Gunn’s fan is made up of 9 lines built at different angles, which represent levels of support and resistance. The center line is 45 degrees.
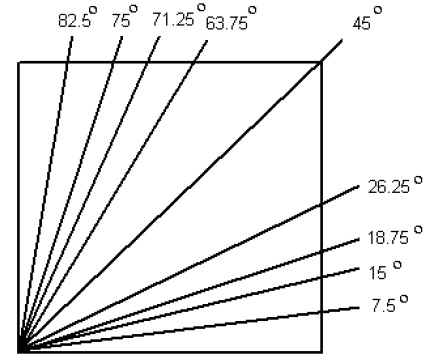
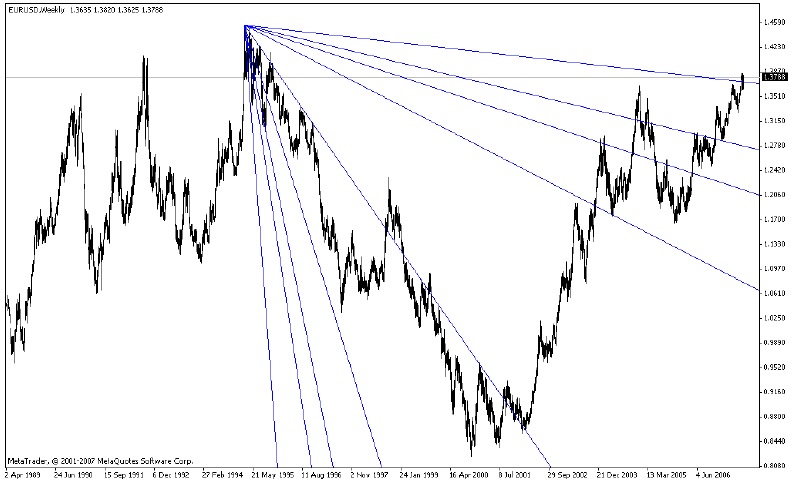
To use Gunn’s Sail, we determine the last historical peak or bottom and stretch in the direction of the next wave at an angle of 45 degrees. The beams of the fan thus obtained serve as a reference point for potential resistances and supports of the price movement.
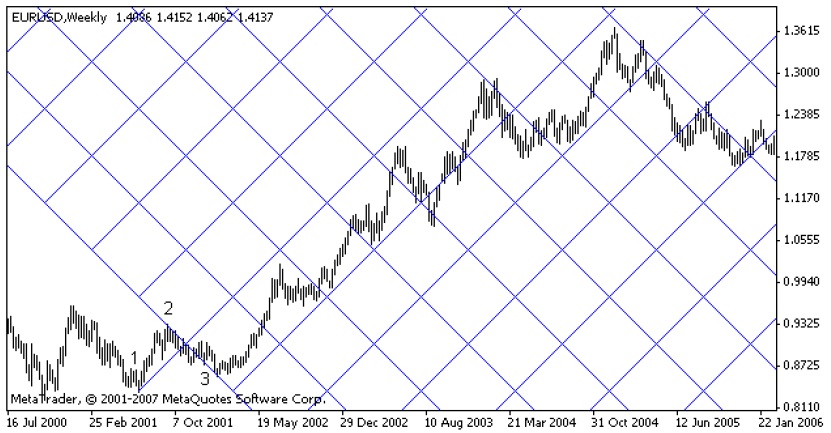
Gunn’s Network
Gunn’s net is built similarly to a fan. At an angle of 45 degrees, from the top or bottom we stretch in such a way as to cover the first cycle in the movement of the price (1,2,3 in the figure). The network thus obtained sets a benchmark for the slope in price movements and temporary resistances and supports. When we have an ascent, the movement conforms to the lines inclined upwards, and when it falls – to those inclined downwards.
Other methods and indicators for proportional analysis
Pivot levels
The Pivot Points method allows you to predict the direction of market movements through some simple calculations. It is very often used by intraday traders. The reference level (Pivot Point) is a price level, the passage of which changes the direction of movement for a particular day. It is calculated on the basis of the closing price values, the maximum and the minimum of the previous day.
Formulas for calculating reference levels:
Pivot Point = (High + Close + Low) / 3
Support 1 = 2 * Pivot – High
Resistance 1 = 2 * Pivot – Low
Support 2 = Pivot – (R1 – S1)
Resistance 2 = Pivot + (R1 – S1)
Support 3 = Low – 2 * (High – Pivot)
Resistance 3 = High + 2 * (Pivot – Low)
If the market opens below the Pivot Point level, it is considered appropriate to take short positions for the day. Accordingly, if the market opens above the pivot point – the day is favorable for opening long positions. The Pivot Point, Resistance 1 and Support 1 levels are considered the most significant. Levels R2, R3 or S2, S3 often correspond to an overbought or oversold market and are therefore often used as a benchmark to exit a position.
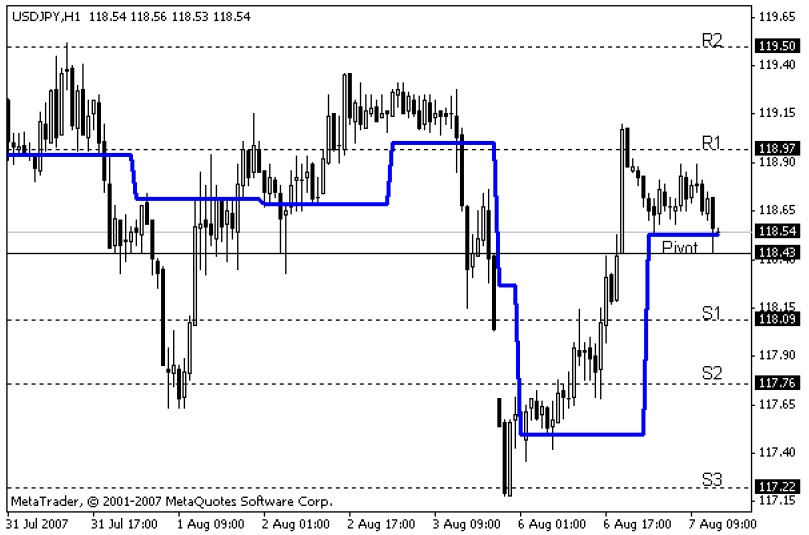
The figure shows an example using the support levels. We see how the price takes into account Pivot Points as resistances and supports. When a level is breached, it reverses its supporting role.
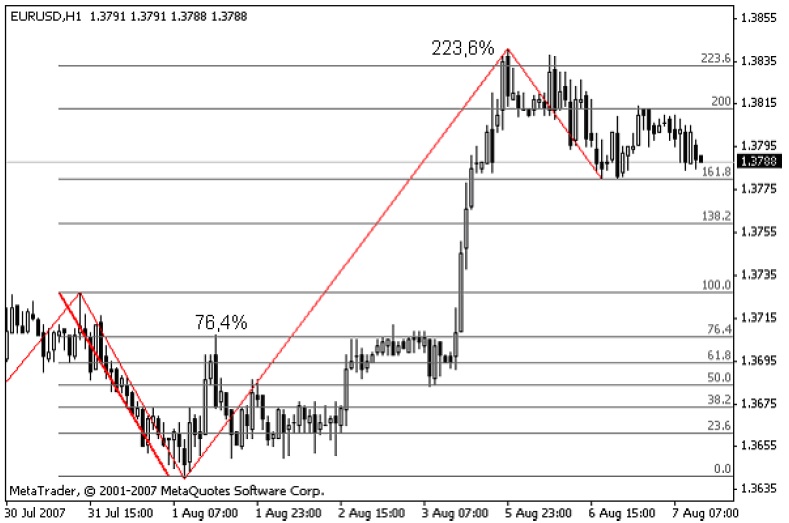
FiboRetracement 3
This indicator projects Fibonacci levels on the last two waves: the long-term and the short-term.
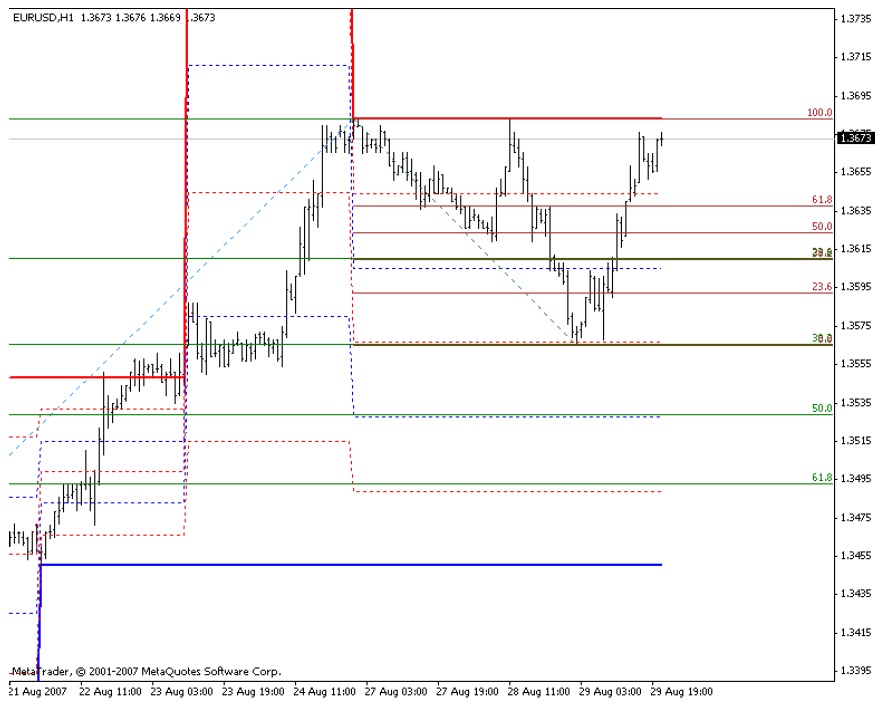
The figure shows an example of using the FiboRetracement3 indicator for the EUR / USD currency pair on a one-hour chart. After rising to the top at 1.3683, the rate makes a downward correction, which stops exactly at the level of 38.2%. The last upward movement stopped consecutively at levels of 38.2% and 61.8% of the decrease.
Fibo Calc
The Fibo Calc indicator is built as a trading system based on Fibonacci proportions. It can be used as a good guide for building a trading strategy by participants trading within the day. The indicator builds Fibonacci levels based on daily fluctuations and sets us a suitable position detection area, a suitable stop area and potential take profit targets, and even indicates the risk / reward ratio.
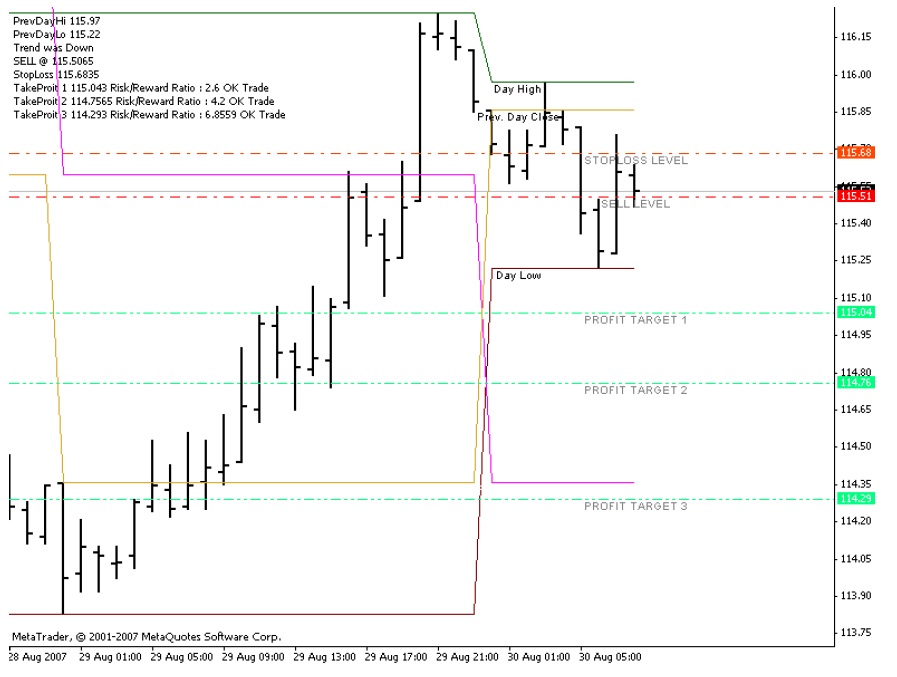
The figure shows an example with the Fibo Calc indicator. The trend that started the day before is used to determine the direction. In this case, the trend is down. The appropriate zone for opening the sell level position (115.51) and the appropriate level for placing a stop (stop level – 115.68) are marked. The appropriate areas for collecting profits (Profit Target 1, 2, 3) with the respective ratios of potential risk and return (Risk / Reward Ratio) are also indicated.
Murray Math
The Murray Math indicator is a system for detecting and trading key levels. It is based on one of the theories of W. D. Gunn, who uses the 1/8 ratio to determine the natural proportions in price movements. Murrey Math’s contribution is that he created a geometric system using selected rules from Gunn’s theory and Japanese candles. The basic principle is
determining the market trend, trading in the trend, quick exit from the market with a profit (from one level to another). The price movement channel is divided into eighths, each of which is a critical level.
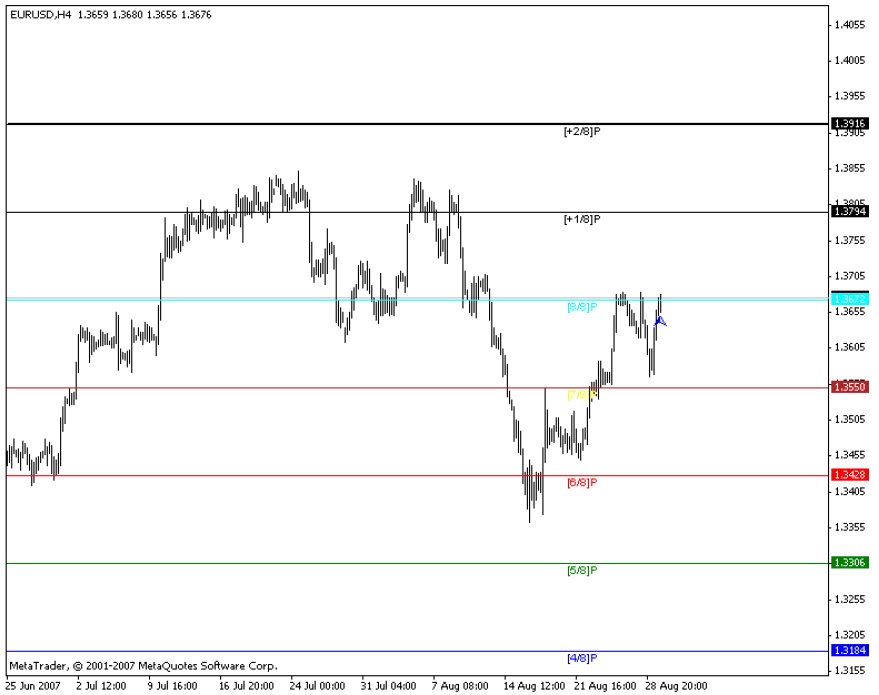
The figure shows an example using Murray Math at EUR / USD on a 4-hour chart. When the market rises, the indicator levels are used as zones of resistance, and when it falls – as support. If the level is breached, then most probably the course will reach the next. In this way, a breakthrough at a certain level is used as a signal to open a position, and reaching the next – to collect profits. This example shows that in eight cases of breakthrough the next level is reached and only in four cases the next level is not reached. Of course, you must also use stops that can be placed on the last peak, in the opposite direction of the signal (breakthrough). In this example, the distance between the levels is 120 pips, and the minimum required stops are about 60. This means that the potential risk of loss to potential profit is in the ratio of 1/2 and at the same time the probability of a successful transaction is twice as high.
Harmonic patterns in the proportions of the waves
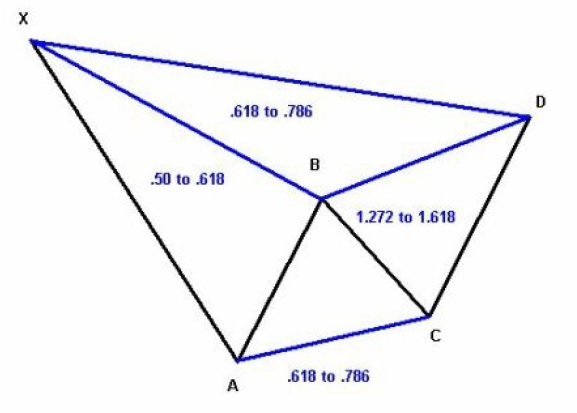
In the 1930s, H.M. Gartley (“Profits In The Stock Market”) describes a series of patterns of price movements that are regularly observed in the financial markets. They were later promoted by Larry Pesavento and Scott Carney. The harmonic models in the price movements are figures of the graphs, with characteristic Fibonacci relations, after which there is a significant reversal in the price. They are used to determine entry points that have a high potential for profit. If we use the terminology of wave theory, most of these models are corrective combinations or final formations, after which usually followed by a strong movement in the opposite direction. They are constantly monitored on the financial markets.
Butterfly
The most common of these models is the so-called Butterfly.
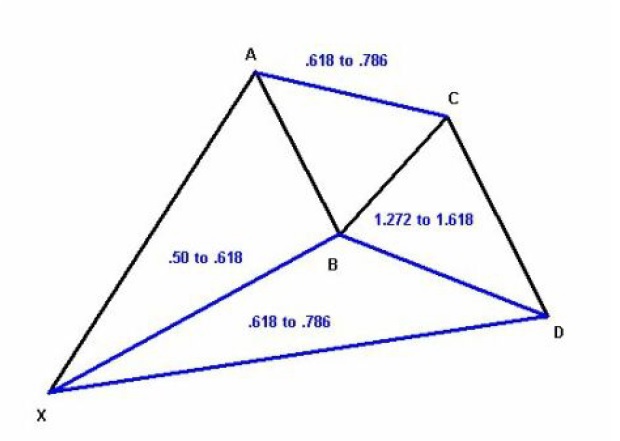
After a strong wave (pulse) in a certain direction, for example upwards (point A in the figure), a corrective combination in the form of a zigzag or flat develops. The first recoil against the main wave reaches levels of 50% – 61.8% correction (point B). This is followed by a recoil upwards (in the direction of the main wave – point C), which reaches about 61.8% of the first decline. This is followed by a new corrective drop (t.D), which reaches the zone 61.8% – 76.4% correction of the length of the whole A. In this formation two triangles with a common point B are formed. These triangles form a figure similar to butterfly, hence its popular name (Butterfly). The practical value of this formation is that a point is obtained (in item D – zone 61.8% – 76.4%) with great potential for profits and low risk. If the market turns in this zone in the direction of the main wave – point A (a sign of this may be the formation of a fractal on a smaller time frame), it will be followed by a strong upward movement with a minimum target level of point A.
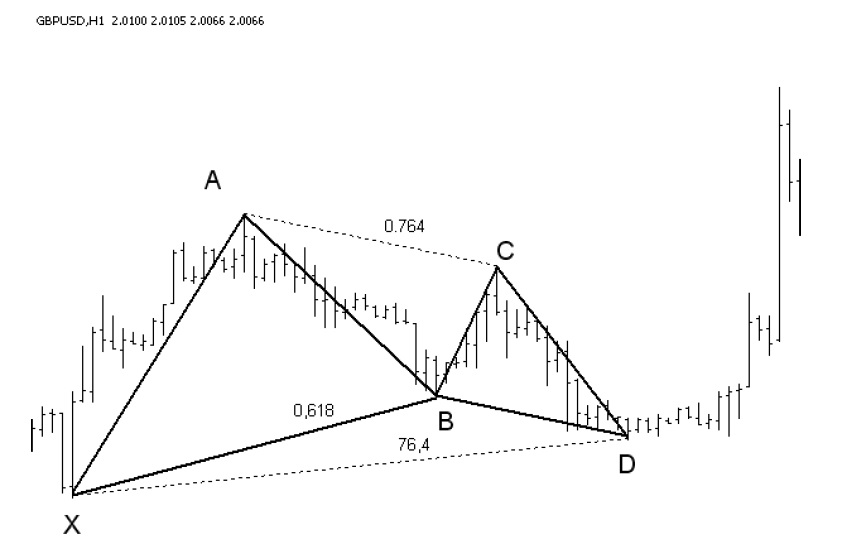
In practice, the figure is quite common in all time charts. We do not need to know the exact wave pattern — whether the formation is a 2nd or 4th wave, or a large zigzag — in all three possible situations, the potential at point D is large. Of course, we must always put a stop loss.
In addition to the classic version, the model is found in other varieties.
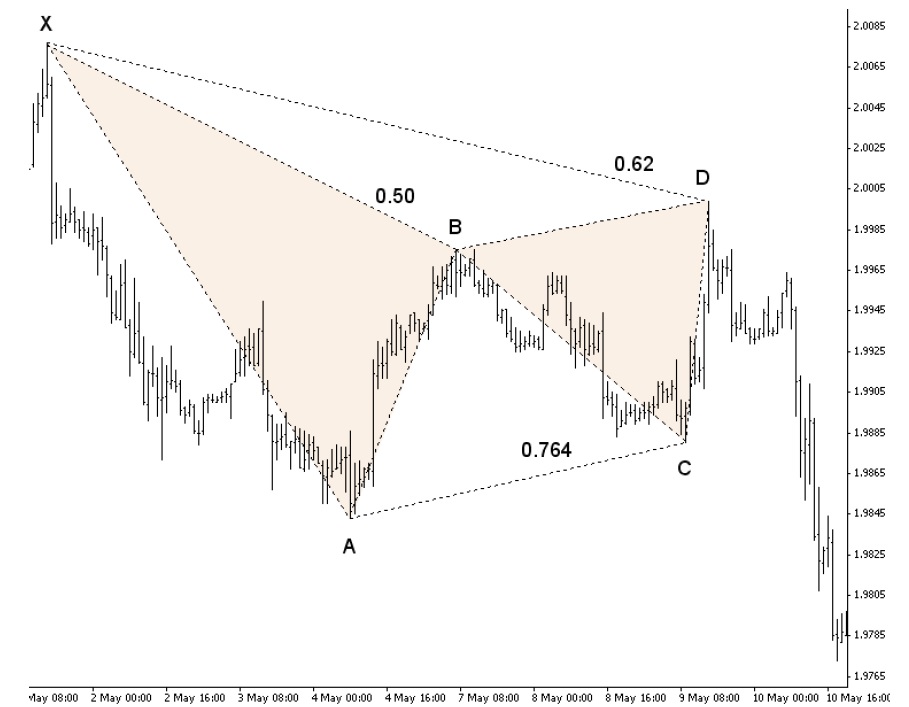
The figure shows the “butterfly” model at GBP / USD, formed on a one-hour chart between May 1 and 9. On May 9, a correction of 62% was reached (at the psychological level 2.00) and the figure was completed at point D, which gave a signal for sales. On May 15, the target of 1,618 was set by AD at the level of 1.9750.
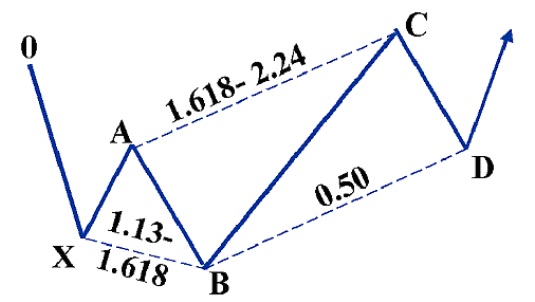
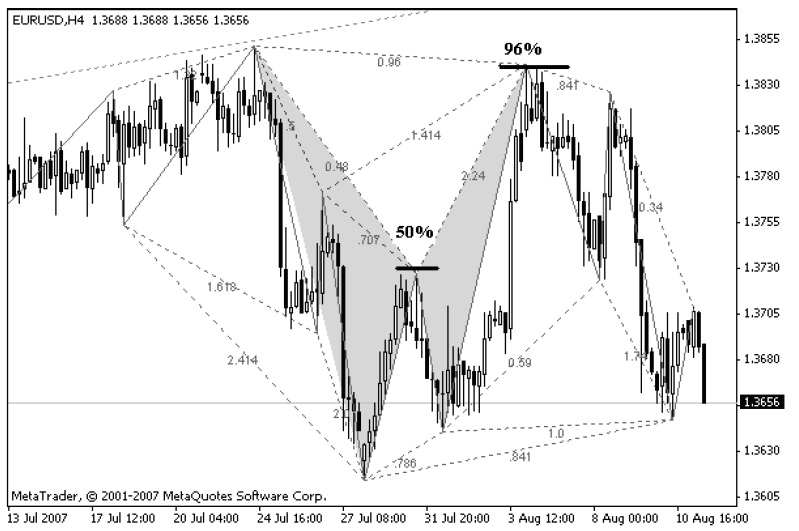
In addition to the classic version, the model is found in other varieties – the so-called model “Crab” and “Bat”.
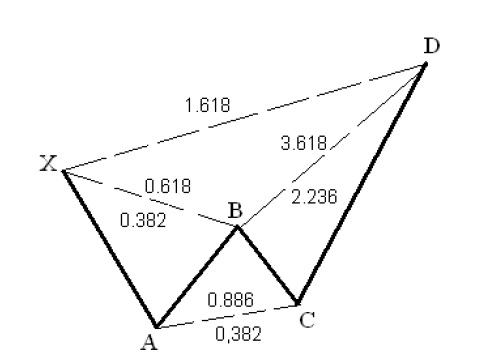
Model Crab
A characteristic aspect of this model is a narrow area of price movement at the potential reversal point D. Point D represents a projection of 1,618 of the X-A movement and a strong expansion (2,236, 2,618 or 3,618) of the B-C wave. The model usually passes the reversing point very precisely and requires a small stop.
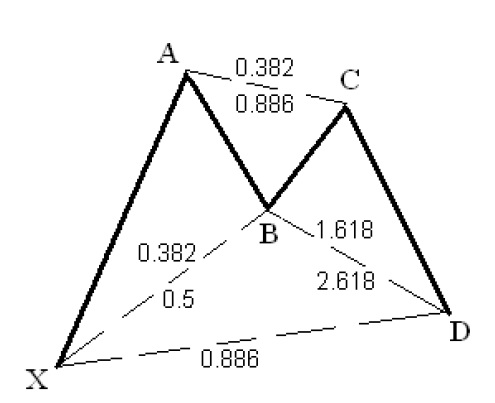
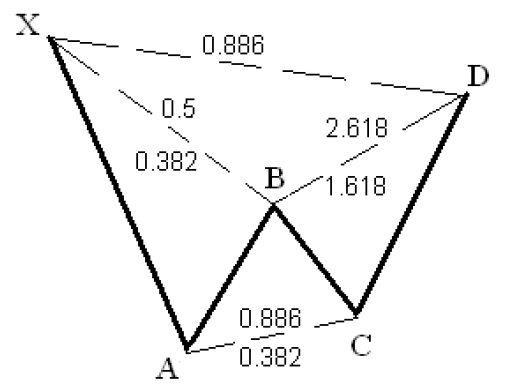
Model Bat
Characteristic of this model is the correction 0.886 of the X-A wave, which determines the potential reversible zone (point D). The recoil at point B must be less than 0.618, for example 0.50 or 0.382 of stroke X-A. The projection of the aircraft for point D is usually smaller, for example 1.618 (up to 2.618).
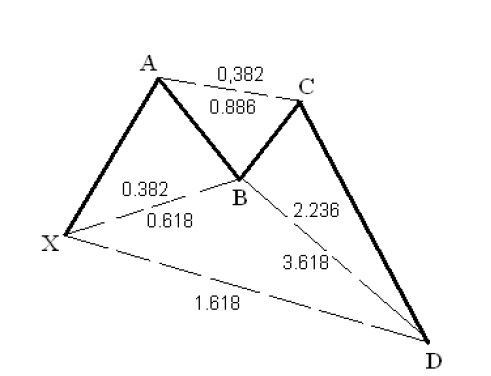
In most of the harmonic models of the butterfly type, a certain proportion (1.27, 1.382, 1.618) or equality between the AB and CD waves is observed, which is another reference point for finding the figures.
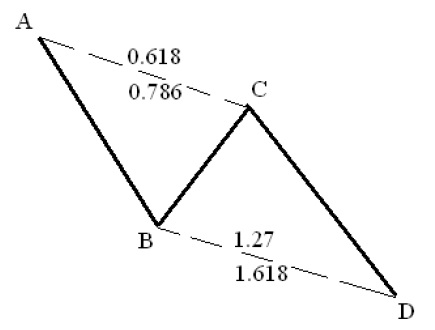
This principle of equality of waves in corrections is quite common and can be used to predict the expected level of inversion (point D). The figure shows the model in practice for the currency pair GBP / USD. This example clearly shows that we have a suitable moment for purchases, at the moment when the second downward wave (CD) is equal in length to the first downward wave, from the beginning of the model (AB).
A special case with equality in the wavelengths AB and CD is the model 5-0.
The bullish model 5-0 is usually the end of some downward movement, in which the final minimum is registered at point B (usually accompanied by a divergence between the bottoms X and B), followed by a sharp rise in price (point D). Signs of the model’s validity are a strong rise after point B (1.618-2.236) and a 50% recoil in the formation of point D.
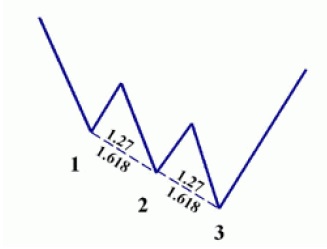
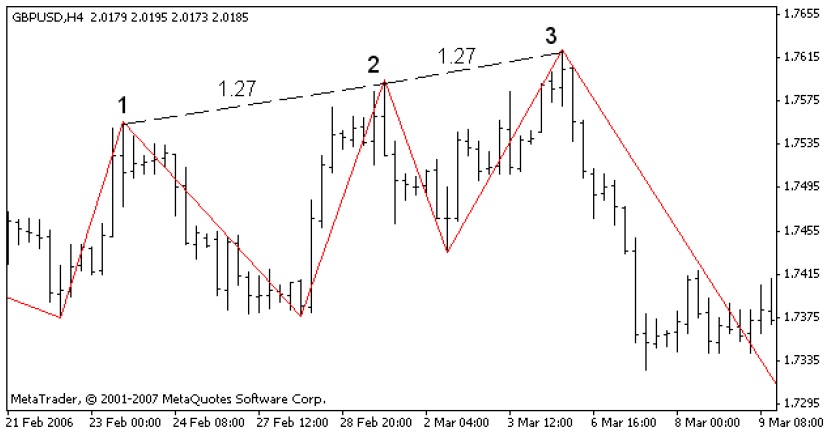
The Three Movements (Three Peaks) model
A characteristic aspect of this model is that each movement ends at 1.27 or 1.618. In addition, the model shows visible symmetry in the movements and equal periods of time. The signals from these figures usually set a great potential for profit and very often they are followed by reversal of longer-term trends. From the point of view of wave analysis, these models represent the so-called “Ending Diagonals” or “Terminal Pulse”.
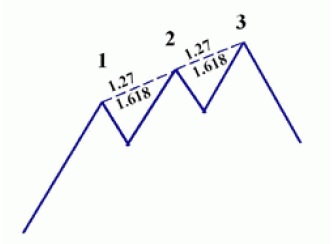
These models usually signal that the traffic is exhausted and we can expect a strong reversal in price. Very often the potential for profits after these figures is great if they are formed at the end of an important trend. The figure shows an example of the model for the currency pair GBP / USD. From the graph we see how each subsequent push upwards passes with the previous peak a little, but a strong ascending wave is not realized. This is a sign that the enthusiasm of the bulls is weakening and we should expect a reversal.
Models are usually easy to identify and provide very good commercial opportunities. In order to detect signals in time and to be able to use them, it is necessary to periodically note the relationships between the waves. The ZUP indicator provides a great advantage in this regard. This indicator notes all the relationships between the waves that are currently forming on the market, using the Zigzag indicator.
The example in the figure shows how easily and in a timely manner we can identify harmonic patterns through the Zup indicator. In this case we have a model that corresponds to a “bat”. The first upward correction ends almost at 0.36% (0.48), and the second triangle at 0.66, where a very convenient moment for sales is obtained.
Disclaimer: The publications on this platform aim to provide useful information on financial topics. But they are NOT financial consultation or advice. Therefore they should not be used as a recommendation for making an investment decision on any type of financial products and services. We use in-depth research in the field but do not guarantee the completeness of the published materials. Always consult a specialist in your particular situation. "Applications In Life" Foundation is not responsible for any adverse consequences resulting from actions taken based on the information provided on the platform.