
This publication aims to help fulfil the mission of “Applications In Life” Fondation to support and develop accessible and understandable financial education by improving financial culture and forward-thinking mentality of the civil society.
Basic principles of technical analysis
Technical analysis – this is a study of market dynamics, most often using graphs to predict future directions. Primary the analysis is considered prices and the change in other factors (volume and open positions), is studied to confirm the correct direction of the price. The graphs reflect the influence of fundamental factors in the market and in the technical analysis takes into account the following tenets:
The market takes everything into account – the market itself indicates its most likely direction on the move. Each price change is matched by a corresponding change to internal factors (economic, political, psychological).
Price movements are subject to trends – from this the following implications arise:
Corollary 1: The current trend is likely to develop in future, but it will not develop in the opposite direction, that is, it is excluded the disorder of the chaotic movement of the market.
Corollary 2: The current trend will develop by the time it starts moving in the opposite direction.
History repeats itself – technical analysis is linked to the study of human psychology. The graphical pricing models that have been separated and classified over the last 10 years reflect the most important features of the psychological state of the market. And if in the past these models worked, then there is every reason to believe that they will continue to work in the future, as long as they are based on human psychology, which has not changed over the years. “History repeats itself”, a bit differently: the key to the future lies in learning about the past.
Aims of the Technical Analysis
- Assessment of the current direction of price dynamics, ie the derivation of the trend.
- Estimation of the period in which a certain direction of movement is active (short and long term, beginning and end of the trend).
- Estimation of the amplitude price fluctuations in the current direction (weak or strong change of course).
The main tool of analytical methods is the indicator, which is broken down into five categories:
- Trend indicator – factors that serve to measure a trend – its strength and duration.
- Change indicator – serves to measure the strength of change in the price of the underlying asset.
- Moment indicator – used to measure the rate of change of a price for a certain point in time.
- Cycle indicator – serves to illustrate cyclic factors and their length.
- Market strength indicator – reports the strength of the current trend.
Graphical technical analysis – this is an analysis of the various graphical models, formed by the determined regularities of the price movement of the graphs, in order to suggest the probable development or change of the existing trend. There are two types of graphic models:
- With the breaking of the trend – the models that appear on the chart, which, if fulfilled under certain conditions, may foreshadow the change of the existing trend in the market.
- Continued trend – emerging chart patterns that, under some of the conditions, confirm that trends are likely to continue.
CHART PATTERNS
Chart Patterns are patterns which occur in trading charts that help traders predict the probable direction the currency pair is likely to move.
Chart patterns may form over any timeframe from a couple of hours to even years. Japanese Candlestick patterns also provide a reliable insight as to where the immediate dırection of the currency pair may head.
Firstly, we will look at chart patterns then candlestick patterns. Sketches have been provided to illustrate the patterns and in a following section a number of real forex charts have been included.
Pattems can be divided into two main categories (a) Reversal Patterns where the market reverses its direction and (b) Continuation Patterns where the market continues in the same direction after a period of consolidation or retracement.
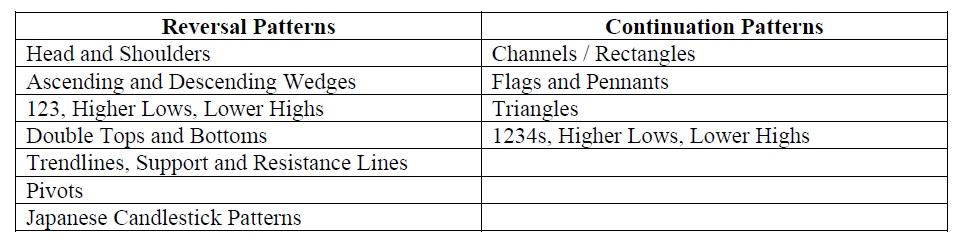
REVERSAL PATTERNS
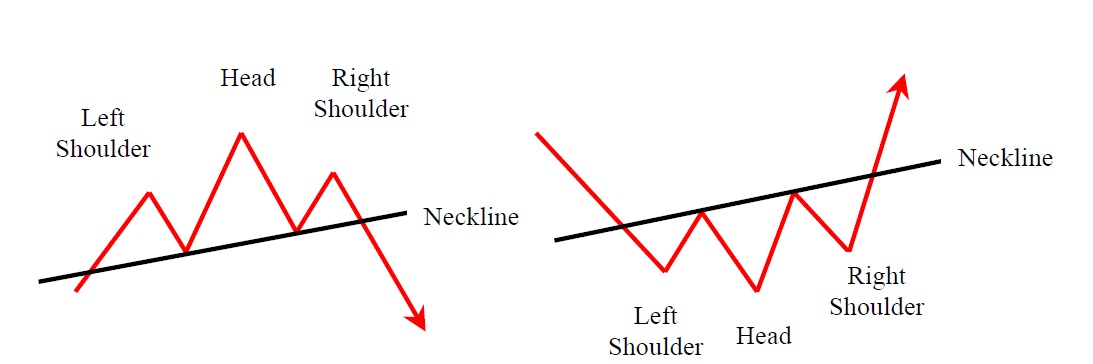
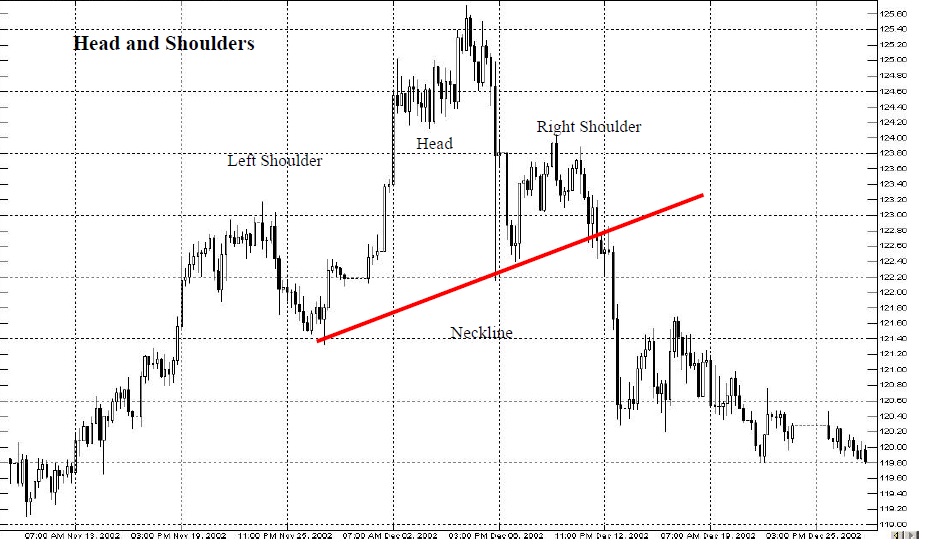
Head and Shoulders
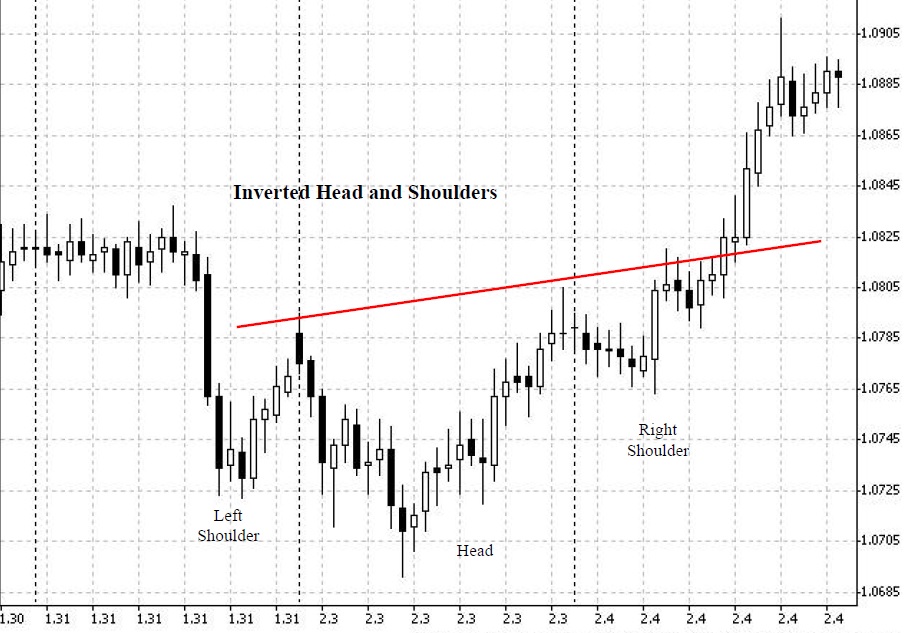
Head and Shoulder Patterns can be normal or inverted. The normal head and shoulders consists of three peaks where the center peak is the highest while the Inverted Head and shoulders consists of three lows with the center low the lowest.
A neckline is drawn through the lowest points either side of the head. A break through the neckline provides a “sell opportunity” With the Inverted Head and shoulders the neckline is drawn through the top of the two peaks either side of the head.A break through the neckline provides a “buy opportunity”.
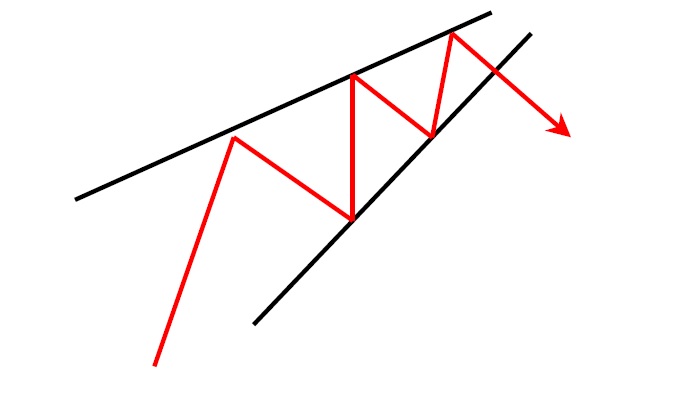
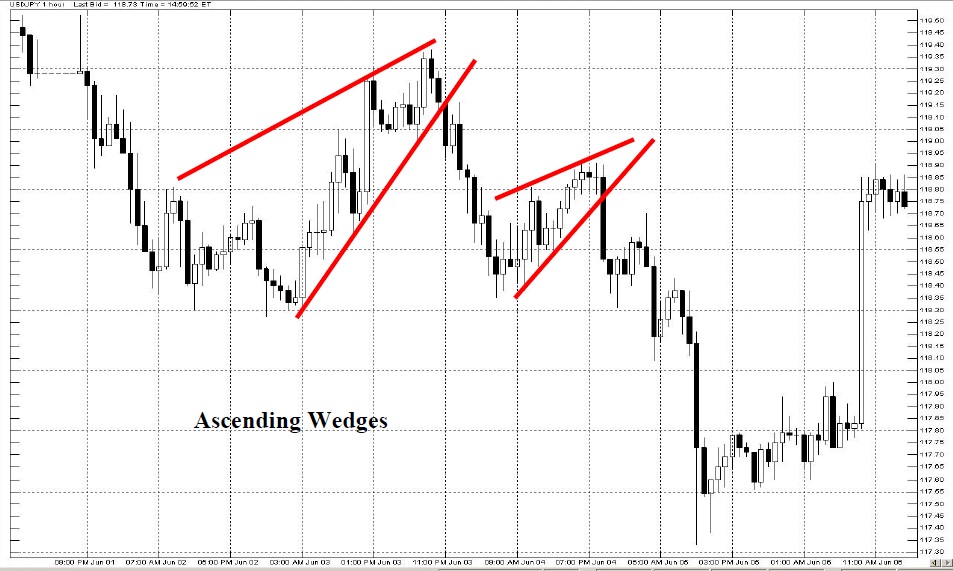
Ascending and Descending Wedges
Ascending Wedge in an uptrend-bearish
This pattern occurs when the slope of price candles’ highs and lows join at a point forming an inclinin wedge. The slope of both lines is up with the lower line being steeper than the higher one. Place an order to breakdown and out of the wedge. The drop out of the wedge can be very dramatic.
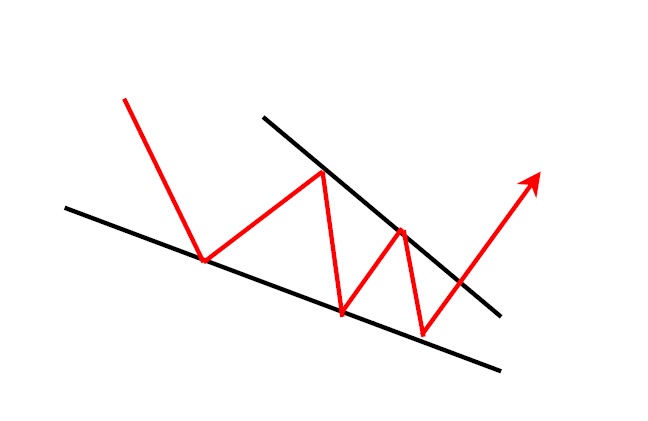
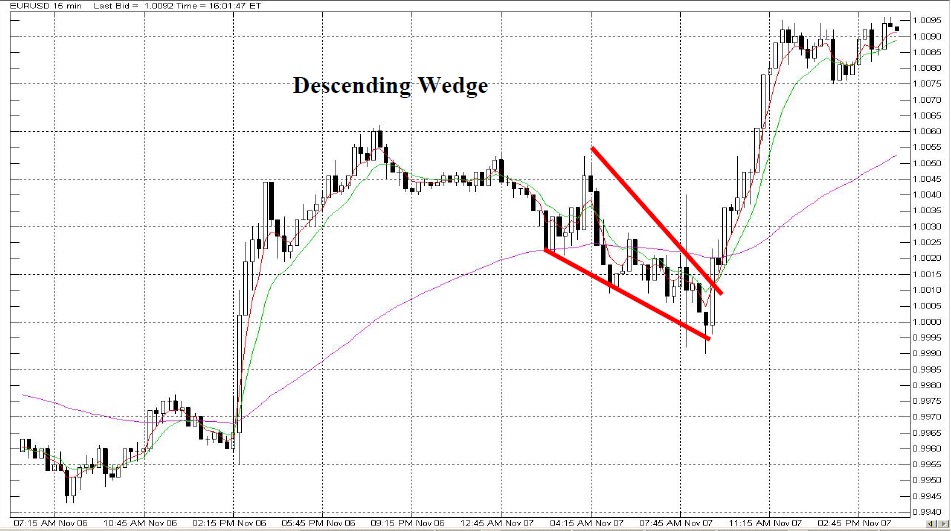
Descending Wedge in a downtrend -bullish
This formation occurs when the slope of the price candle high and lows join at a point forming a declining wedge. The slope of both lines is down with the upper line being steeper than the lower one. To trade this pattem, place an order on a break up and out of the wedge.
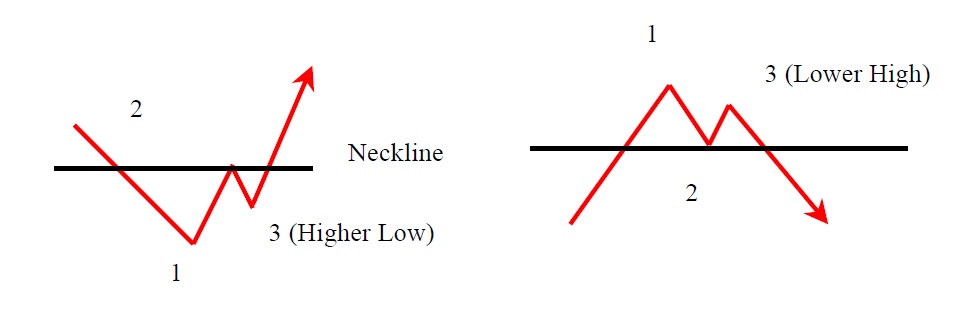
123s Higher Lows and Lower Highs
This pattern can also be a continuation pattern, but at the top or bottom of a trend this pattern provides a good confirmation of the direction change. The “3” point is a failed retest of the previous High or Low. The failure of the test signifies the change from a Bull market to a Bear market and vice versa. The “3” point can also be referred to as a Higher Low or a Lower High. This pattern is very useful for finding a trade entry when there isn’ta CI system entry.
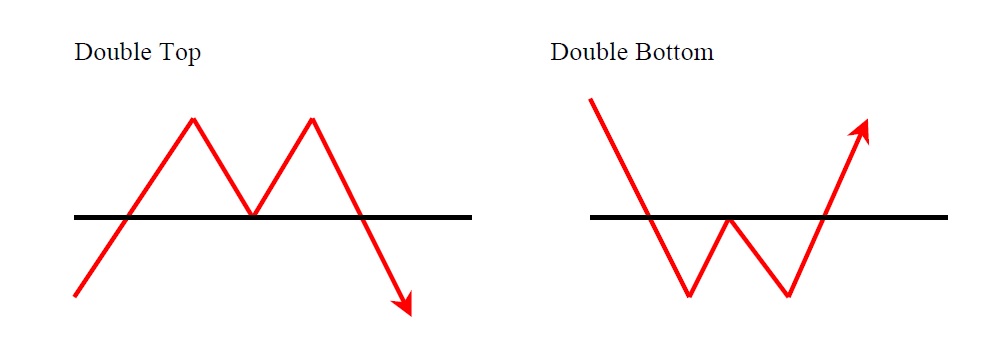
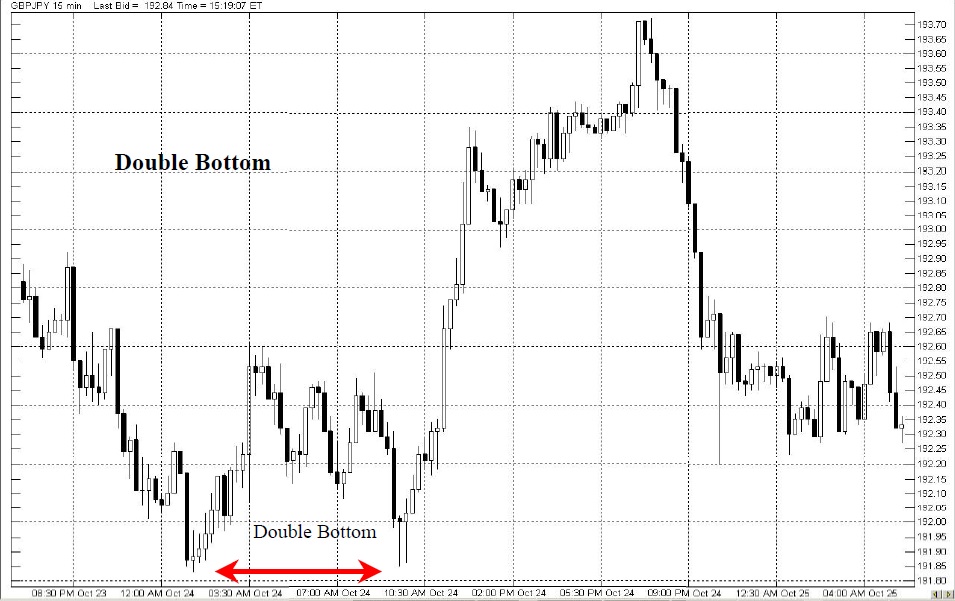
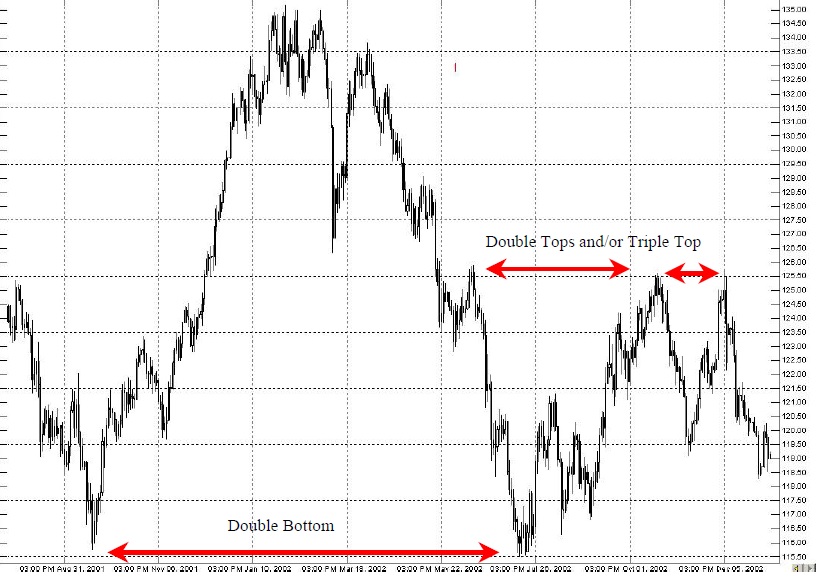
Double Tops and Double Bottoms
Double tops and bottoms are one of the most well known and powerful money making techniques known by forex traders. They are a test of a previous high or low. Triple Tops and Triple Bottoms are similar but have three Peaks or Lows
A double top occurs when the price attempts to break out above a recent pivot high but fails this pattern consists of two tops of approximately equal height. Many traders wait for the confirmation when the retracement low beneath the two peaks is broken to the downside after the second peak.
When a double top has been formed, the price objective is usually an equal distance down beyond the correction low (valley between the two peaks). Double tops are not as strong in a strong up trend as they are in a downtrend.
The mirror image of the double top is the double bottom – a bullish formation. Support cannot be established until there is a test of the last point of support.
Double tops (M shaped) and double bottoms (W shaped) are stronger if the equal points are a long way apart. The two peaks of a double top do not have to be exactly at the same level so allow a few pips difference.
A double bottom with a slightly higher low for the second point can be a strong bullish signal. Double bottoms are not as strong in a strong downtrend as they are in an up trend. A double bottom which coincides with a pivot line can produce a fast move upwards.
Trendlines, Support & Resistance Lines
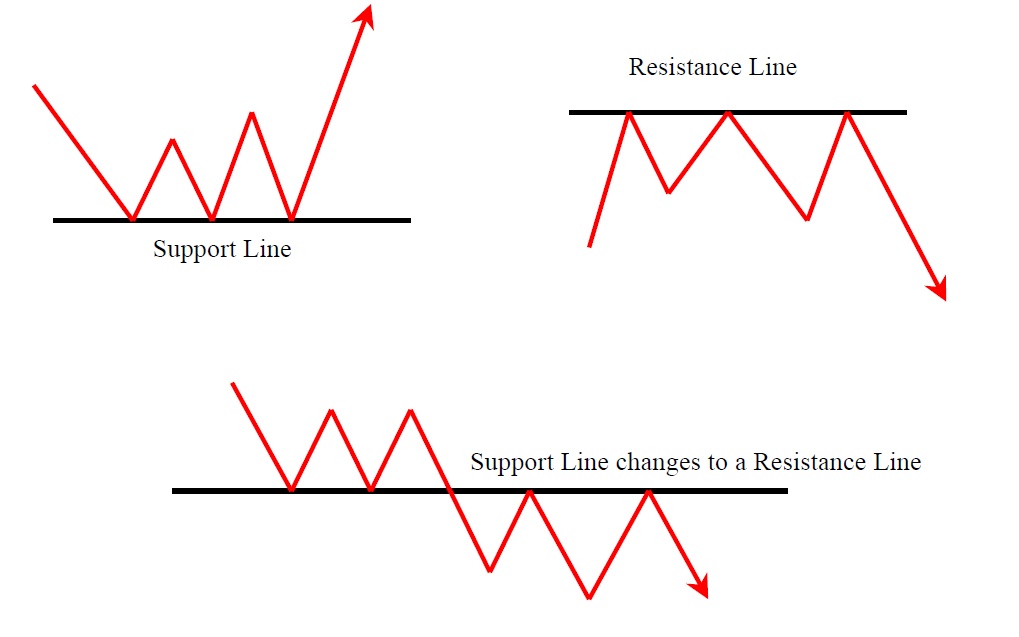
Support and Resistance Lines
Support and Resistance Lines can be both horizontal and sloping.
Resistance Lines are drawn through previous pivot highs. Resistance acts like a ceiling.
Depending on its strength, a resistance line can pause an up trend and when very strong can reverse an trend. Its strength is determined by the length of time it serves as resistance and the number of times it has been touched by price. The longer the period of time, the greater the strength of the line. Some traders will sell at resistance lines.
Support Lines act like a floor and are price areas where a currency pair finds 1t difficult to penetrate
below the Support Line. Support lines are drawn through a previous set of lows and can either pause a downtrend or reverse it depending on the strength of the Support Line. Some traders buy at Support Lines. All Traders see the same thing.
Do not BUY close to RESISTANCE LINES
Do not SELL close to SUPPORT LINES
as there is a good chance there will be a reversal
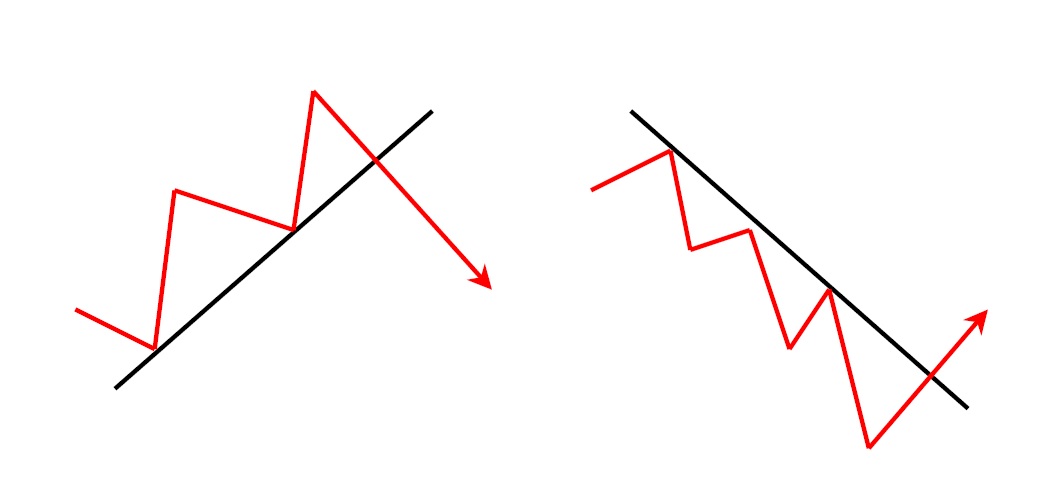
Trendlines
It is important for traders to know which way the market is going, 1.e. is it trending up or down or even going sideways. Money can be made in all these conditions, but it is important that traders “Trade with the Trend”
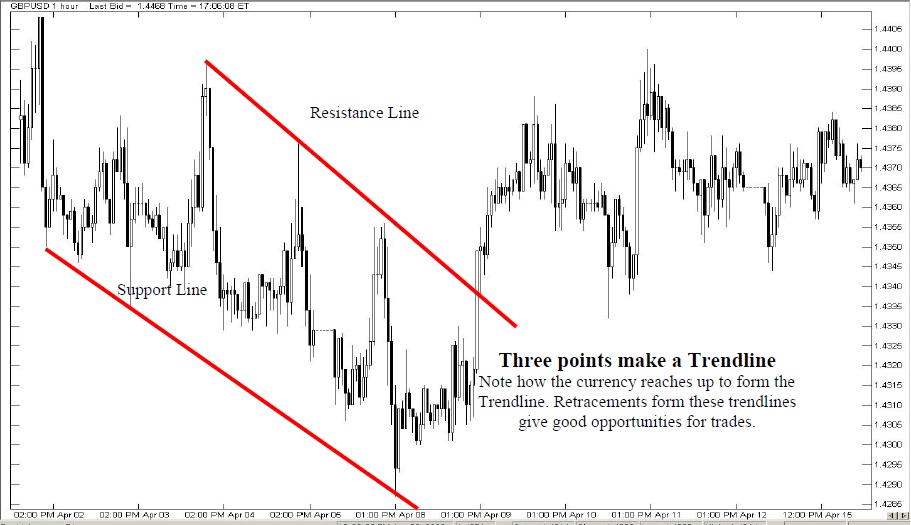
A trendline is a straight line that connects key prices areas in a move, an up trendline connects successive Higher Lows or Higher Highs and a down trendline connects successive Lower Highs or Lower Lows.
Trendlines connecting successive Lower Highs is also known as a resistance line while a trendline connecting successive Higher Lows is also known as a support line.
Trendlines can be defined as border lines for making buy or sell decisions. Trendlines form the boundary lines for most of the chart patterns as will been seen in later sections.
A Trendline of about 45 degrees is considered the most reliable, and if steeper than that the market typically cannot sustain that kind of momentum for long.
Watch to see if the market bounces off a trendline or slices through.
Watch for retests of the trendline after the price has sliced through.
You will often find good buying or selling points at the 3rd touch of a trendline.
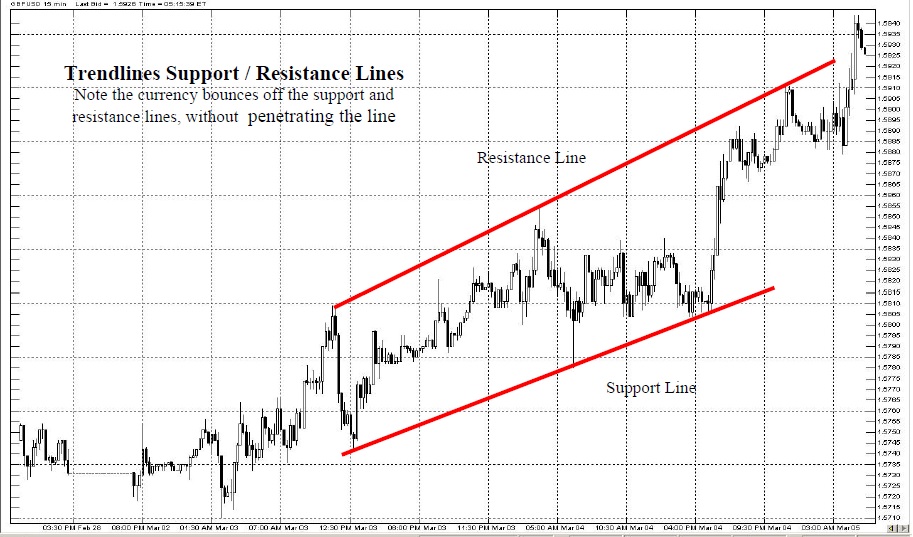
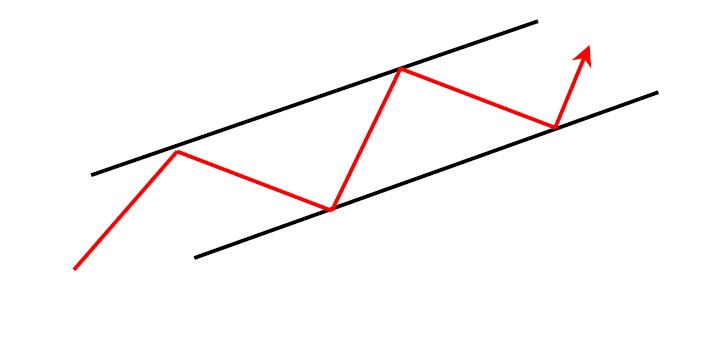
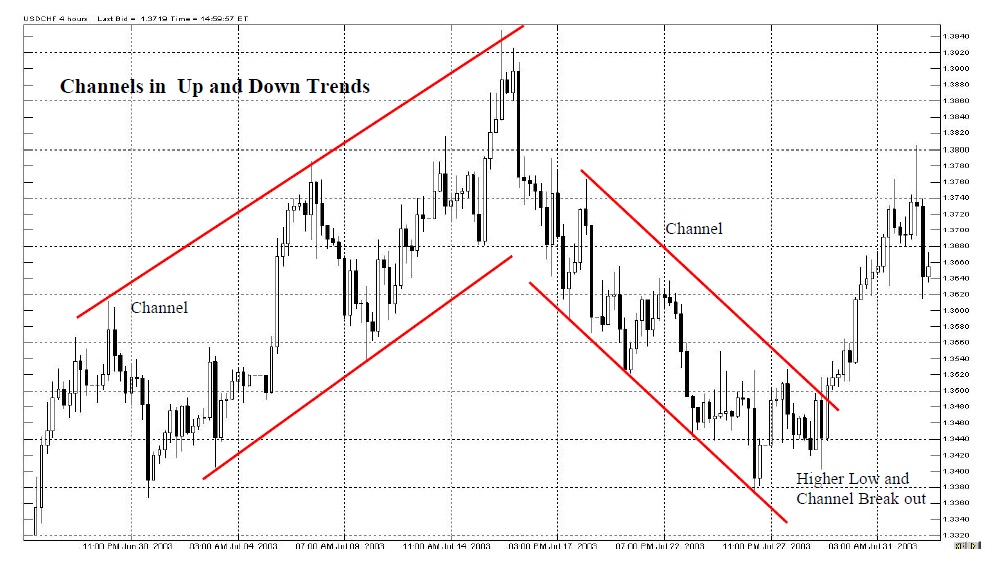
Channels
When prices trend between two parallel trendlines they form a channel. When prices hit the bottom trendline, this may be used as a buying area and when prices hit the upper trendline, this may be used as profit taking area and vice versa.
Breakouts of trendlines and support and resistance lines provide good areas for buying or selling.
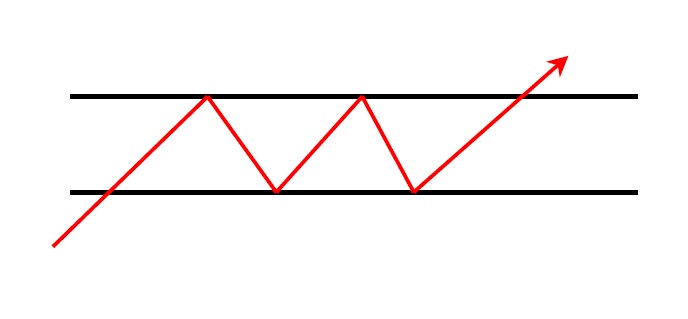
Channels can be upward or downward sloping and horizontal
CONTINUATION PATTERNS
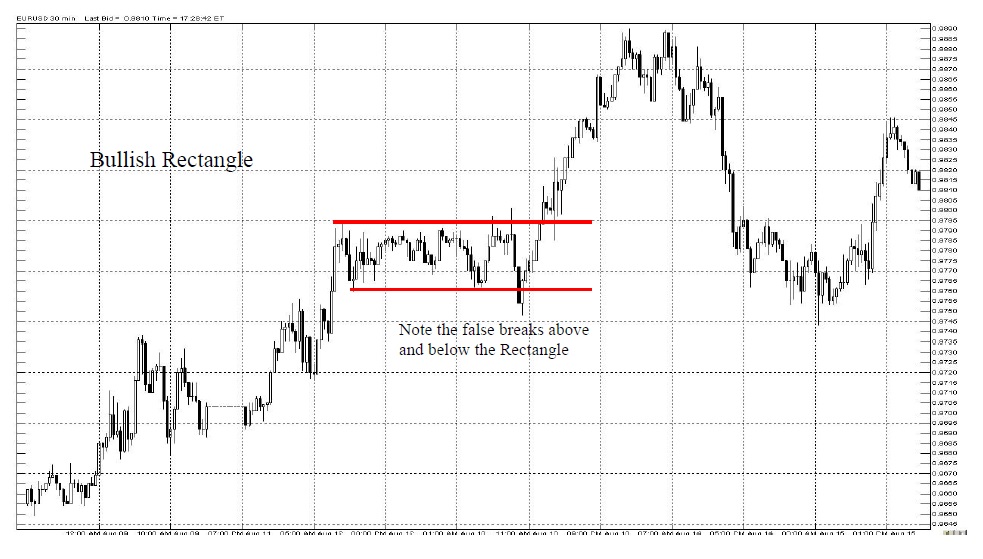
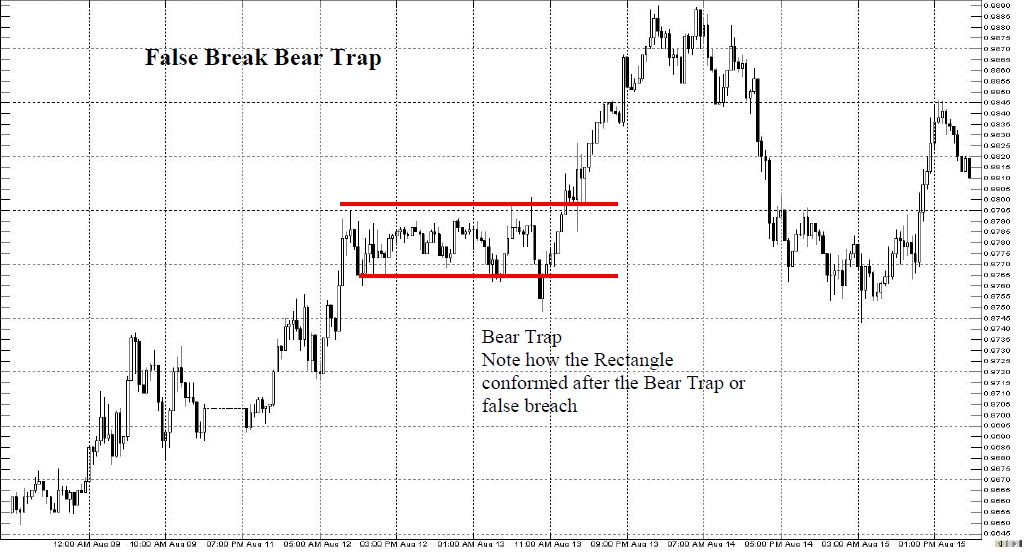
Rectangles
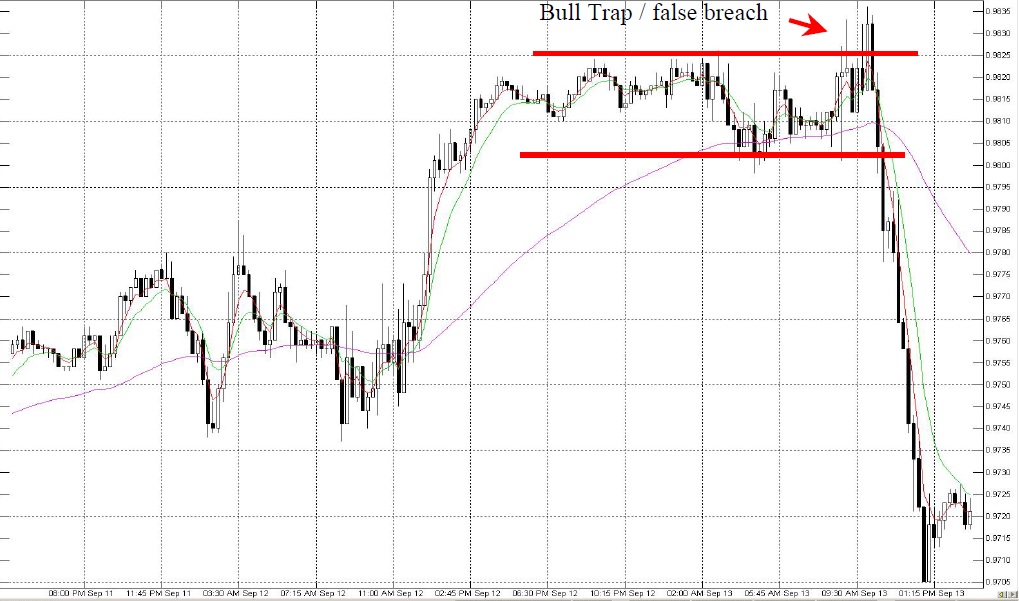
Rectangle -bullish in an up trend
When the market is flat, draw a line through the highs and a line through the lows. Buy when the market closes above the straddle. Sometimes, there will be a bull trap and the market will break back into the rectangle and below the support line.
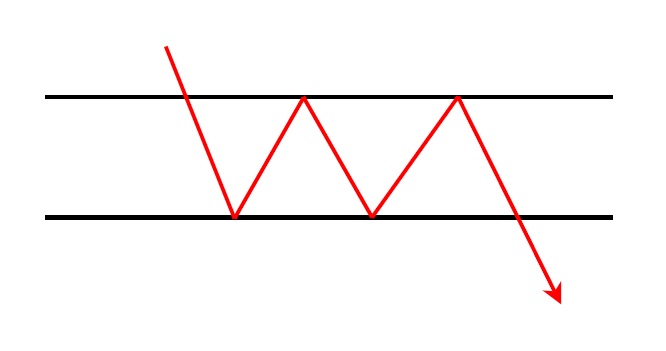
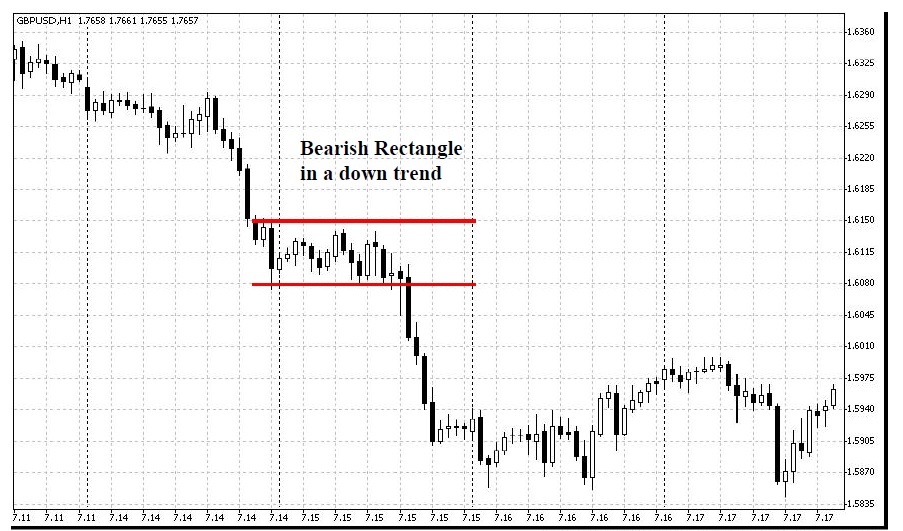
Rectangle- bearish in a downtrend
Sell when price breaks below support and closes below support.
Ascending Triangles
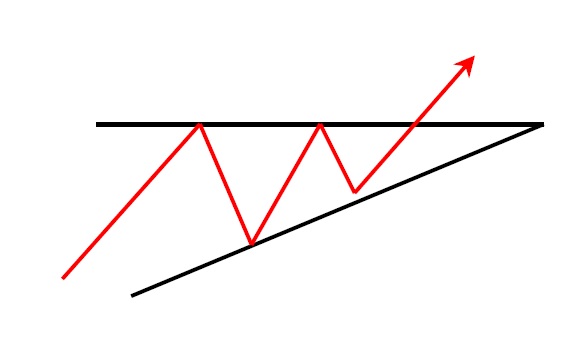
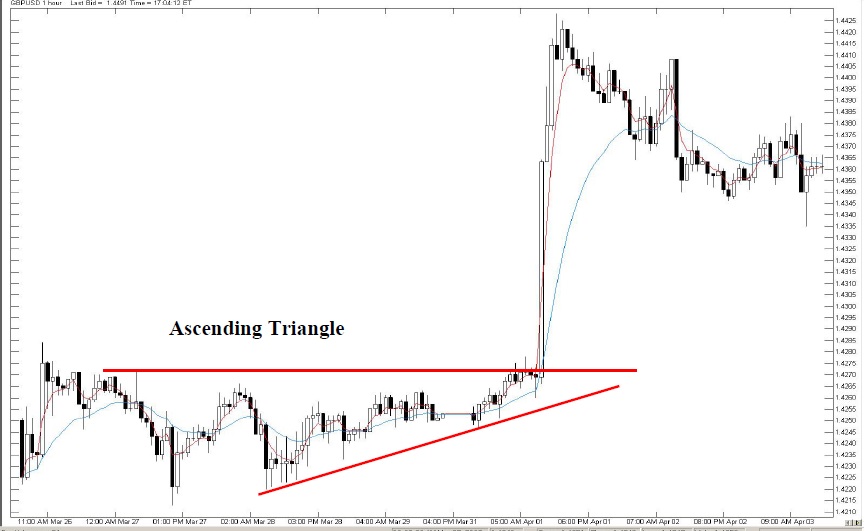
Ascending Triangle in an up trend -bullish
A formation in which the slope of price highs and the slope of price lows are converging to a point. The resistance line is parallel to the bottom edge of the chart while the support line is upward sloping. Place buy order on a break up and out of the triangle. However, if the pattern fails, sell when the market breaks out and below the triangle
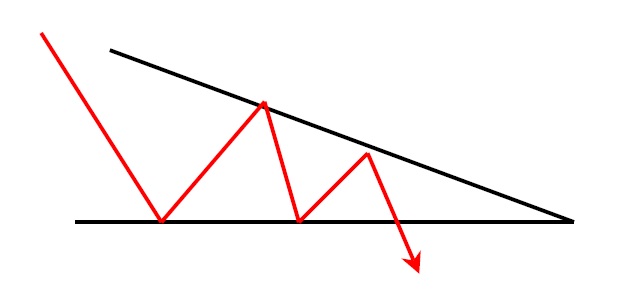
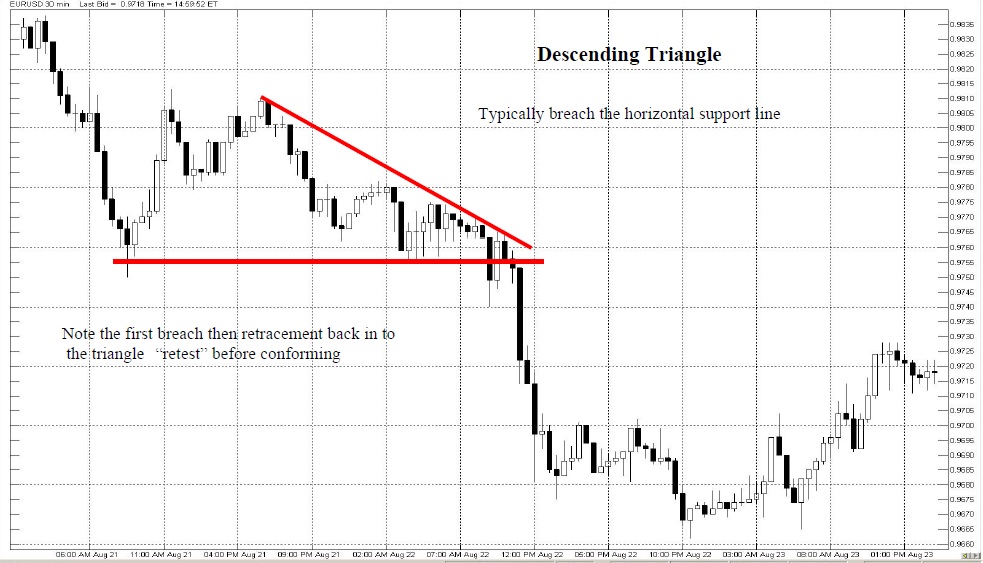
Descending Triangle in a downtrend -bearish
The defining characteristic of descending right angle triangles is the pattern of declining highs and a series of equal lows. This combination of points can be connected to form a right angle triangle. The hypotenuse should be sloping from higher to lower and left to right. An illusory double bottom invites one last batch of weak hands to buy just before a sharp break signals major selling. Sell when price breaks out and down.
Descending triangles are amongst the most reliable of all technical patterns because both supply and demand are easily defined.
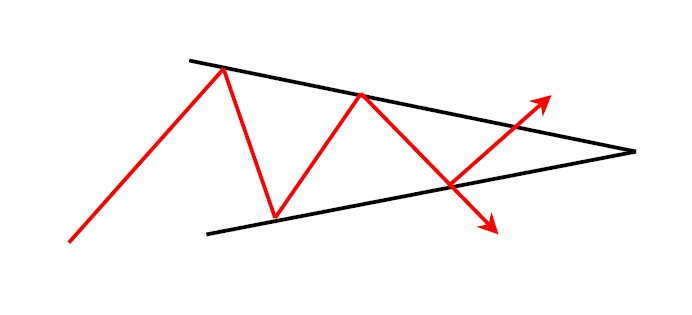
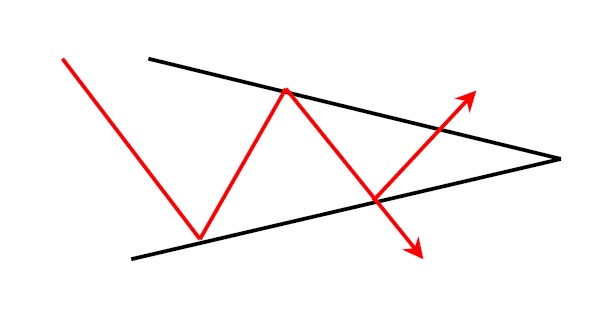
Symmetrical Triangles
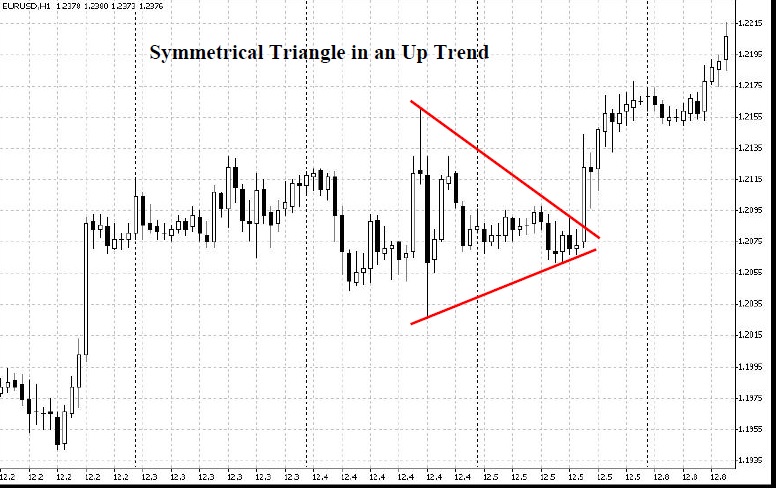
Symmetrical Triangle in an uptrend -bullish
A symmetrical triangle is a formation in which the slope of price highs and lows are converging to a point.
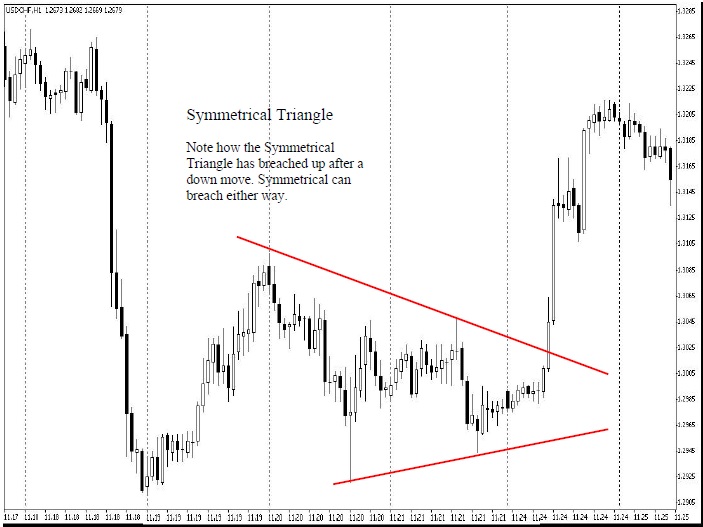
Support and resistance are sloping. Symmetrical triangles are formed by rallies and sell-offs, each smaller than the last. As time moves on, an event is imminent. The move will be explosive.
Place a order on a break up and out of the triangle but the price could go in the opposite direction.
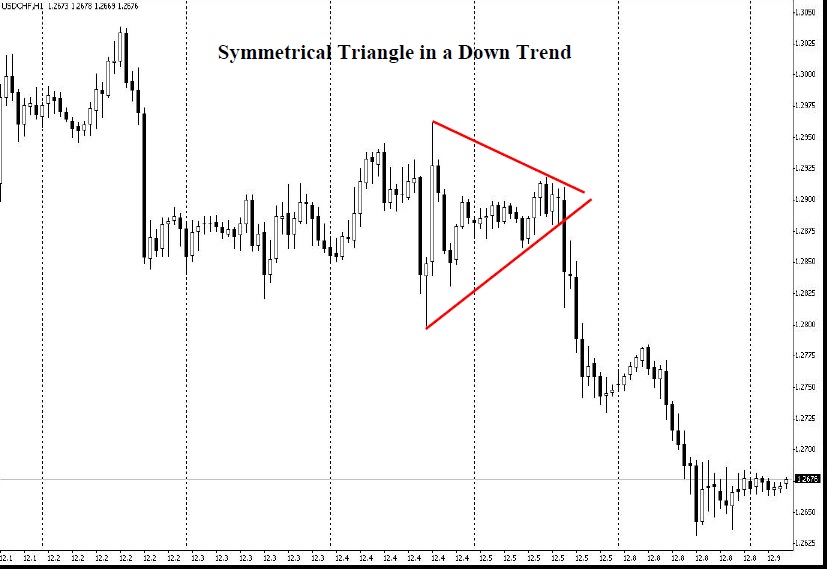
Symmetrical Triangle in an downtrend –bearish
Place a sell order on a breakout the triangle.
Flags
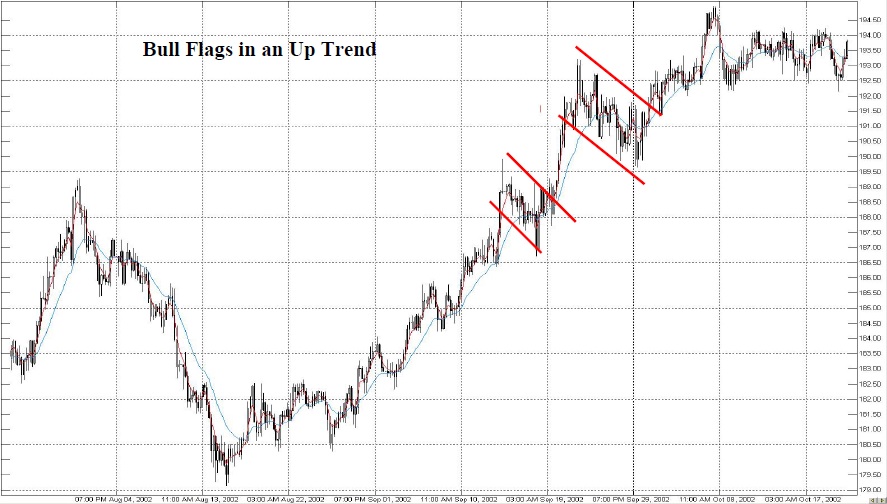
Bull Flag in an up trend-bullish
Bull flags are characterized by lower highs and lower lows with pattern slanting against the trend. Their trendlines run parallel.

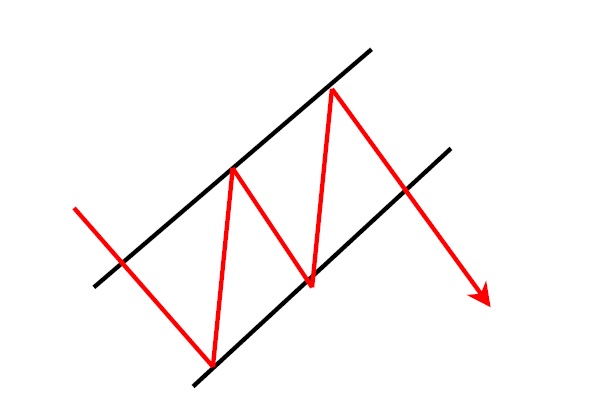
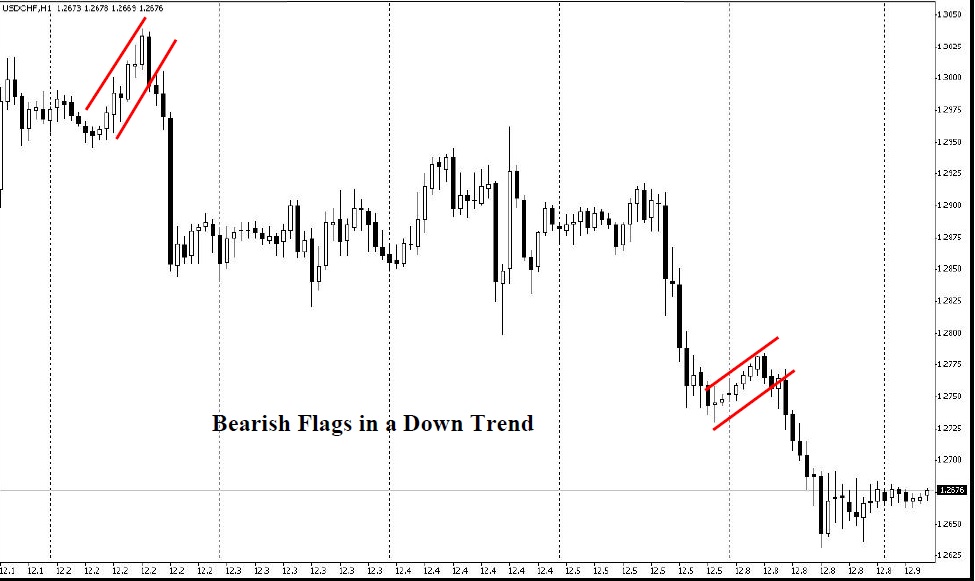
Bear Flag in a down trend-bearish
Bear flags have higher highs and higher lows and slope against the trend. Their trendlines run parallel.
Flags are typically seen right after a big, quick move.
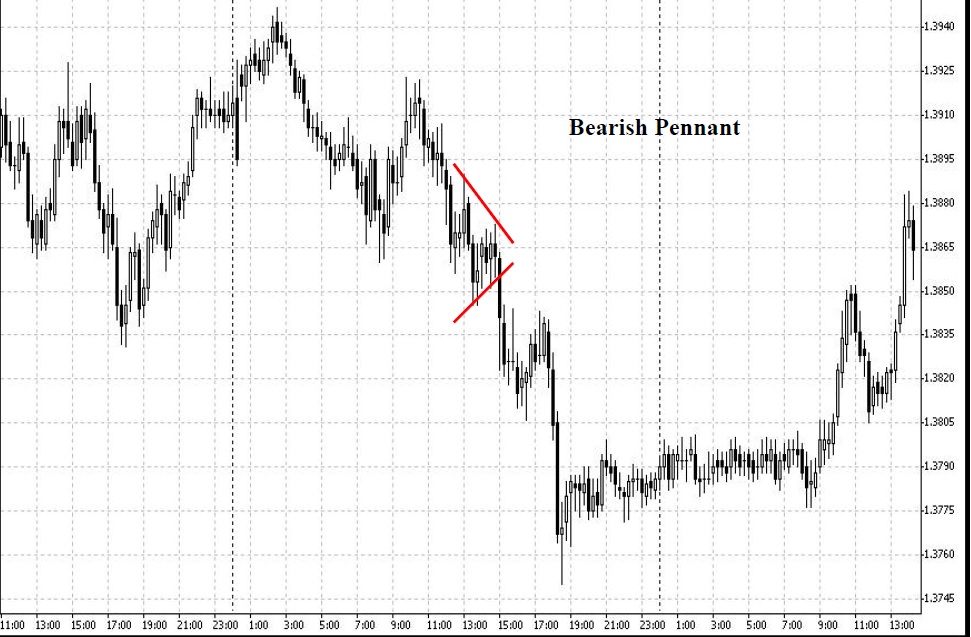
Pennants
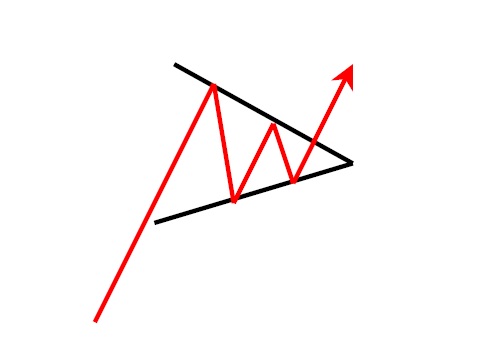
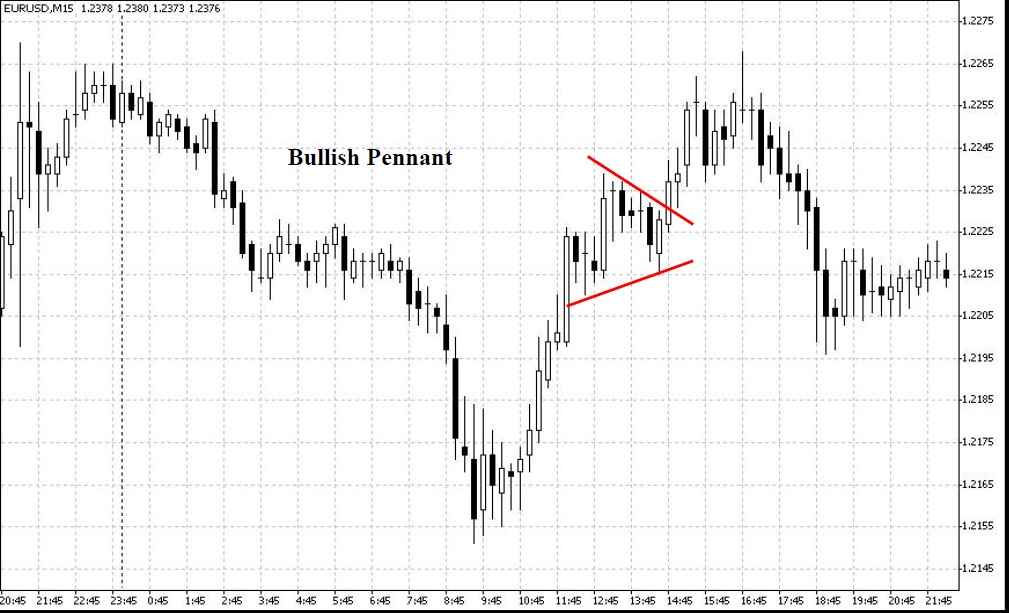
Bullish Pennant in an uptrend-bullish
The bullish pennant looks similar to a symmetrical triangle but is typically smaller in size (volatility) duration. These are similar to Bullish Flags and have a triangle pattern rather than a flag pattern”
Bearish Pennant in a downtrend-bearish
These are similar to Bearish Flags and have a triangle pattern rather than a “flag pattern”

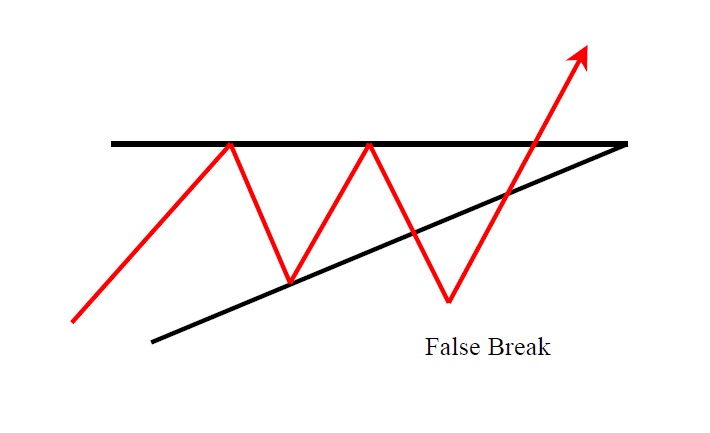
False Breaks
Note: If price does not move in the expected direction, the pattern has failed. However traders can reverse their trade and still make a profit.
False Breaks produce fast moves
A false breakout occurs when price moves up past a previous pivot high and suddenly reverses for a fast move in the opposite direction.
A false break can also appear when the market breaks out of the top or bottom of a triangle or other common pattern and reverse through the bottom or top of the pattern unexpectedly.
A false breakdown occurs when price moves down past a previous pivot low and suddenly reverses up for a fast move.
False breaks occur when the market breaches a chart pattern then suddenly reverses for the main move.
Sometimes this is done by traders “setting up” the market, and typically the false break stops and turns on a Fibonacci point or on a Support or Resistance Line
This occurs reasonable often and can also be the setup for the major move. Sometimes this a test of a previous point of significance like a trendline, low or high or fibonacci line etc.
Retracement System
If you buy every retracement when the market is going up, you will be wrong only once at the top.
A well known saying is “buy dips in a rally”.
Similarly, if you sell every retracement when the market is trending down, you will be wrong only once at the bottom. A well known saying is “sell rallies in a downtrend”.
It is easier for a market to continue its dırection than to reverse its direction. This is known as persistence of trend. Look for retracements to start at critical points Fibonacci levels, trendlines, support, resistance, pivot lines &previous highs and lows.
Trade with the trend and enter after a retracement and take profits as best you can. Wait for a pivot to form and enter in the direction of the trend, Enter on a candle which makes a swing high or swing low and closes back in the direction of the trend.
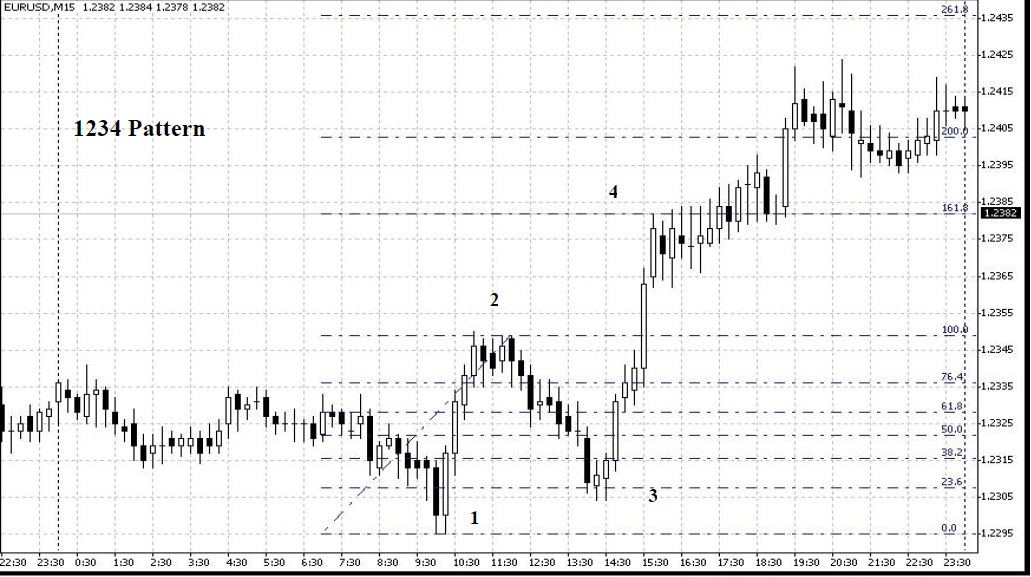
If price starts at point 1, moves up to point 2 and retraces to point 3, a trader can buy just above point 3 and the target will be point 4. Point 3 is a higher low pivot point and a higher low is a safe entry. Good rallies start from lows. Buy the first pullback from a new high. There is always a crowd that missed the first boat.
In a downtrend, a higher low will change the short term trend.
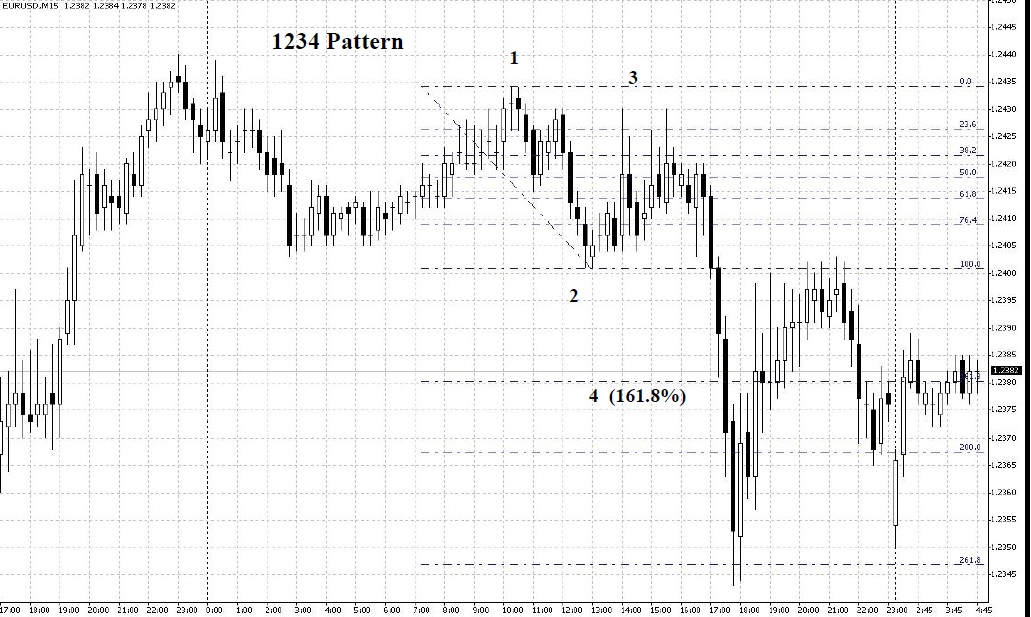
Similarly, if the price starts at point 1 and moves down to point 2, and retraces up to point 3, a trader can sell just below point 3. The target will be point 4. Point 3 is a lower high pivot and a safe entry. Good declines start from highs. In an up trend a lower high will change the short term trend to a downtrend.
Reversals build slowly. If the market has been moving down for a long time, the first sharp rise usually finds sellers. Similarly if the market has been moving up for a long time, the first sharp dip usually finds buyers The market does not turn on a dime.
BUY
In the diagram below, for the retracement system, the market tumed at point 3(the low of the red bar). The pivot or tuming point was confirmed when the green bar to the right of the red bar at point 3 went above the high of the red bar at point 3 by 1pip. You would buy there and place a stop loss just under the low of the red bar (point 3) if the number of pips between your stop loss and your entry point was not too high i.e. you are not risking too many pips. If you cannot enter the trade within a reasonable distance from your stop loss, you would wait for a better trade.
Our exit point will be at a trendline, pivot line, Fibonacci projection, resistance point, Candlestick reversal pattern or other reversal pattern
SELL
If you look at right half of the diagram below, you will see another point 3. A lower high pivot is formed in the downtrend when the market retraced to point 3 (the high of the green bar) when the next bar, a red one goes 1 pip below the low of the green bar the pivot or turning point is confirmed so you could sell one pip below the low of that green bar The stop loss would be 1 or 2 pips above point 3.
Our exit point wvill be at a trendline, pivot line, Fibonacci projection, support point, Candlestick reversal pattern or other reversal pattern.
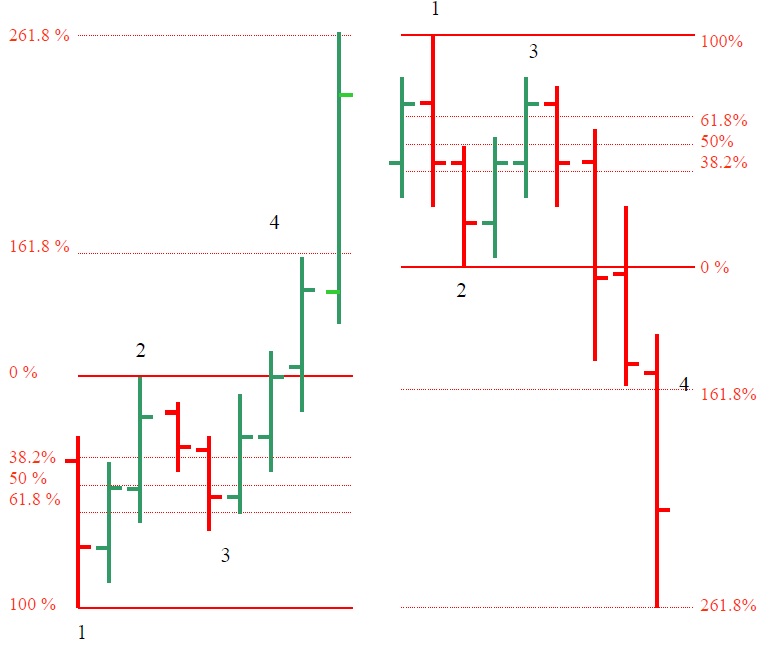
When the retracement at 3 from the move 1 to 2 is approximately 61.8% expect the target move to be either 161.8% or 261.8% (Watch for other significant lines as well)
When all your lines on the chart (eg. Trendlines, Fibonacci Lines and Pivot Lines) you may find a more profitable target. trading the 1234 pattern the 4 point or the 161.8% is typically the target.
Disclaimer: The publications on this platform aim to provide useful information on financial topics. But they are NOT financial consultation or advice. Therefore they should not be used as a recommendation for making an investment decision on any type of financial products and services. We use in-depth research in the field but do not guarantee the completeness of the published materials. Always consult a specialist in your particular situation. "Applications In Life" Foundation is not responsible for any adverse consequences resulting from actions taken based on the information provided on the platform.