
This publication aims to help fulfil the mission of “Applications In Life” Fondation to support and develop accessible and understandable financial education by improving financial culture and forward-thinking mentality of the civil society.
What is a moving average (MA)?
In statistics, the moving average is a calculation used to analyze data points by creating a series of averages of different subsets of the complete data set. In finance, the moving average (MA) is a stock indicator commonly used in technical analysis. The reason for calculating the moving average of the stock is to help smooth the price data by creating a constantly updated average price.
By calculating the moving average, the impact of random, short-term fluctuations on the stock price over a period of time is mitigated.
Simple vs. exponential moving averages: an overview
Traders use moving averages (MA) to identify trading areas, identify trends and analyze markets. Moving averages help traders isolate a stock or market trend, or lack thereof, and can also signal when a trend may reverse. Simple and exponential are two of the most common types. We will check at the differences between these two types of moving averages, helping traders determine which one to use.
Over a period of time, moving averages reveal the average price of a tradable instrument. Still, there are different ways to calculate averages and this is why there are different types of moving averages. They are called “moving” because the price movement adds new data to the calculation, thus changing the average.
Simple moving average
To calculate a 10- day simple moving average (SMA), add the ending prices of the last 10 days and peak by 10. To calculate a 20- day moving average, add the ending prices for a 20- day period and peak by 20.
Given the following series of prices:
- $ 10, $ 11, $ 11, $ 12, $ 14, $ 15, $ 17, $ 19, $ 20, $ 21
The SMA calculation would look like this:
- $ 10 + $ 11 + $ 11 + $ 12 + $ 14 + $ 15 + $ 17 + $ 19 + $ 20 + $ 21 = $ 150
10-day period SMA = $ 150/10 = $ 15
Old data fall away in favor of new data. Thus, the 10-day moving average is recalculated by adding the new day and dropping the 10th day, and this process continues indefinitely.
Exponential moving average
The exponential moving average (EMA) focuses further on recent prices than on a long series of data points, as a simple moving average is needed.
To calculate the EMA
Current EMA = (Price (current) – previous EMA) X multiplier) + previous EMA
The most consequential option is the smoothing constant, which = 2/ (1 N), where N = the number of days.
10-day EMA = 2 / (1 + 10) = 0.1818
For illustration, a 10 day EMA weighs the closing price at18.18, with each data point also going lower and lower.
The EMA works by weighing the difference between the price of the current period and the previous EMA and adding the result to the previous EMA. The shorter the period, the greater the weight applied to the latest price.
Key differences
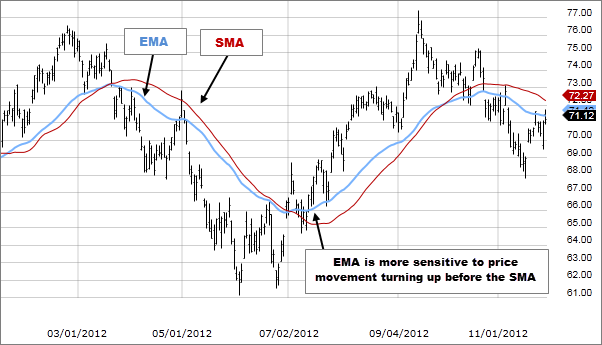
SMA and EMA are calculated differently. The calculation makes the EMA react faster to price changes and the SMA reacts more slowly. This is the main difference between the two. One isn’t unavoidably better than the other.
Sometimes the slower moving SMA keeps the person in the trade, leading to greater profits after the end of the movement, while the EMA will react quickly, forcing a trader to exit trading in a market hiccup. In other cases, the opposite may happen. A faster moving EMA signals problems faster than an SMA, and so the EMA dealer escapes the danger faster, saving that person time and money.
Note that with EMA, each data point included in the average decreases its weight over time until it is eventually removed as new data points are added that carry higher weights. So in the case of a 10-day EMA, the weight of a new data point on the first day will drop to just 6.67% of its original weight after five closing prices.
According to his specific strategy, each trader must decide which MA is better. The traders want to be warned as soon as the price moves in the other direction, that’s why many short-term traders use EMA. Long-term traders are slow to act and prefer to be less actively involved in their trades, so they tend to rely on SMAs.
As a general guideline, when the price is above the simple or exponential MA, then the trend is up, and when the price is below the MA, the trend is down. For this direction to be useful, the moving average must give an idea of trends and changes in past trends. Choose a calculation period – such as 10, 20, 50, 100 or 200 – that highlights the trend, but when the price moves, it tends to show a reversal. This applies whether a simple or exponential MA is used.
Test different MAs to see which works best by changing the indicator inputs on your metatrader platform. Different MAs work better on different types of financial instruments, including stocks.
- Important: In the end, it all comes down to personal preferences. Draw an EMA and an SMA with the same chart length and see which one helps you make better trading decisions.
Special considerations
As lagging indicators, moving averages serve well as lines of support and resistance. During an uptrend, the price will often retreat back to the MA zone and then bounce off it.
If prices break below the MA in an uptrend, the uptrend may weaken or at least the market may consolidate. If prices break above the moving average in a downward trend, the trend may begin to move up or consolidate. In this case, the trader can monitor the movement of the price through the MA to signal an opportunity or danger.
Other traders are not so concerned about prices moving through the MA, but will instead place two MAs with different lengths on their chart and then watch the MAs cross.
Sometimes MA crossovers provide very good signals that would lead to big profits, and other times crossovers lead to bad signals. This highlights one of the faults of moving averages. They work well when the price makes big trend movements, but they tend to do badly when the price moves sideways.
For longer periods, watch the 50- and 100-day or 100- and 200-day moving averages for the longer term. For example, using 100- and 200-day moving averages, if a 100-day moving average crosses below the 200-day average, this is called a death cross. A significant downward move is already underway. A 100-day moving average that goes above a 200-day moving average is called a gold cross and indicates that the price has gone up and can continue to do so. Short term traders may be looking at 8- and 20-period MAs, for example. The combinations are endless.
Disclaimer: The publications on this platform aim to provide useful information on financial topics. But they are NOT financial consultation or advice. Therefore they should not be used as a recommendation for making an investment decision on any type of financial products and services. We use in-depth research in the field but do not guarantee the completeness of the published materials. Always consult a specialist in your particular situation. "Applications In Life" Foundation is not responsible for any adverse consequences resulting from actions taken based on the information provided on the platform.