
This publication aims to help fulfil the mission of “Applications In Life” Fondation to support and develop accessible and understandable financial education by improving financial culture and forward-thinking mentality of the civil society.
In most trading books, MACD divergence is discussed and is often cited as a reason for reversing the trend or why the trend may reverse. Given the divergence, it looks great; many examples can be found in which reversal is preceded by MACD mismatch.
However, look closely and you will find that many twists are not preceded by a mismatch and often the deviation does not lead to a reversal at all. Let’s dive into what MACD divergence is, what causes it, and how to improve the use of divergence, before we assume that divergence is a reliable tool to use in your trade.
What is indicator divergence?
This is when an oscillator or momentum indicator, such as a moving average convergence divergence indicator (MACD), does not confirm a price movement. For example, the stock price makes a new high, while the MACD indicator or the relative strength index (RSI) makes a lower high.
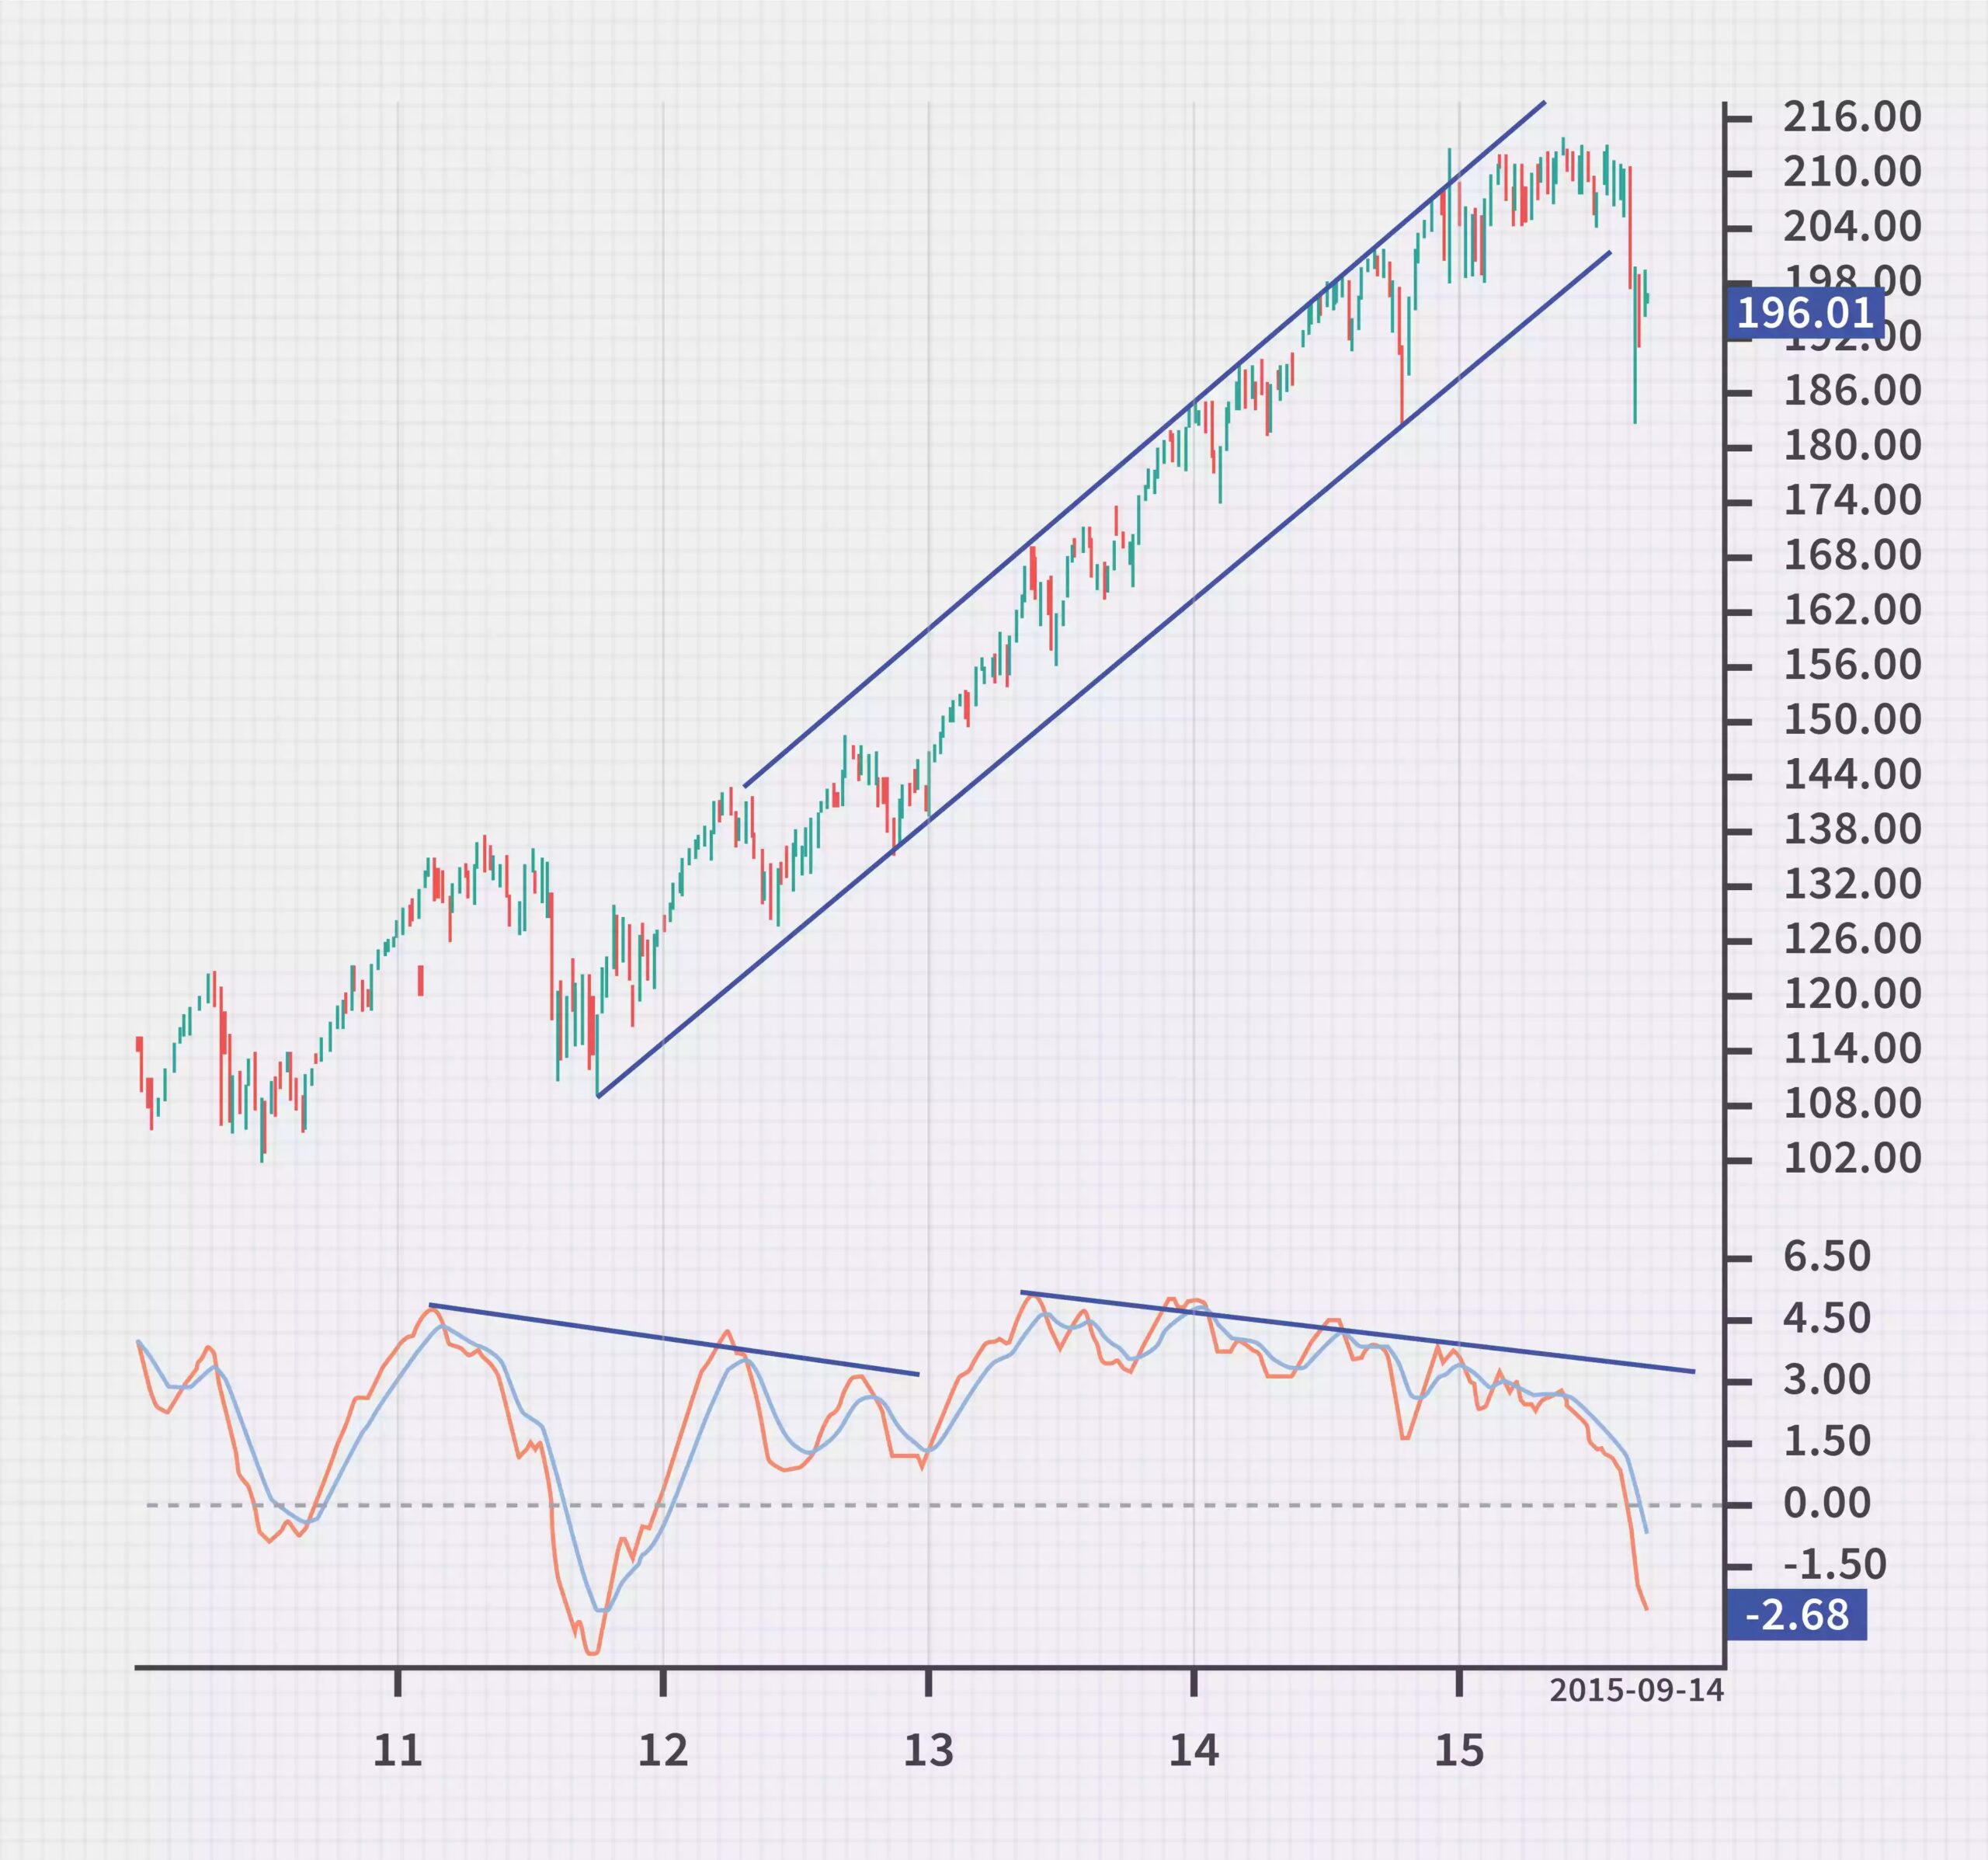
In the graph above you can see an example of a divergence during an uptrend. The price is going up, but MACD several times doesn’t make new peaks and instead creates lower peaks.
The divergence of the indicators aims to show that the momentum decreases during the trend and is therefore more susceptible to reversal. However, the difference is not good at the moment when the reversal will occur, as shown in the graph above. Already in 2012 there was a divergence on the chart, although the uptrend continued in 2015 with significant deviations at the end of 2014 and 2015. This is a bearish divergence: when the indicator makes lower peaks, while the price makes higher swing tops.
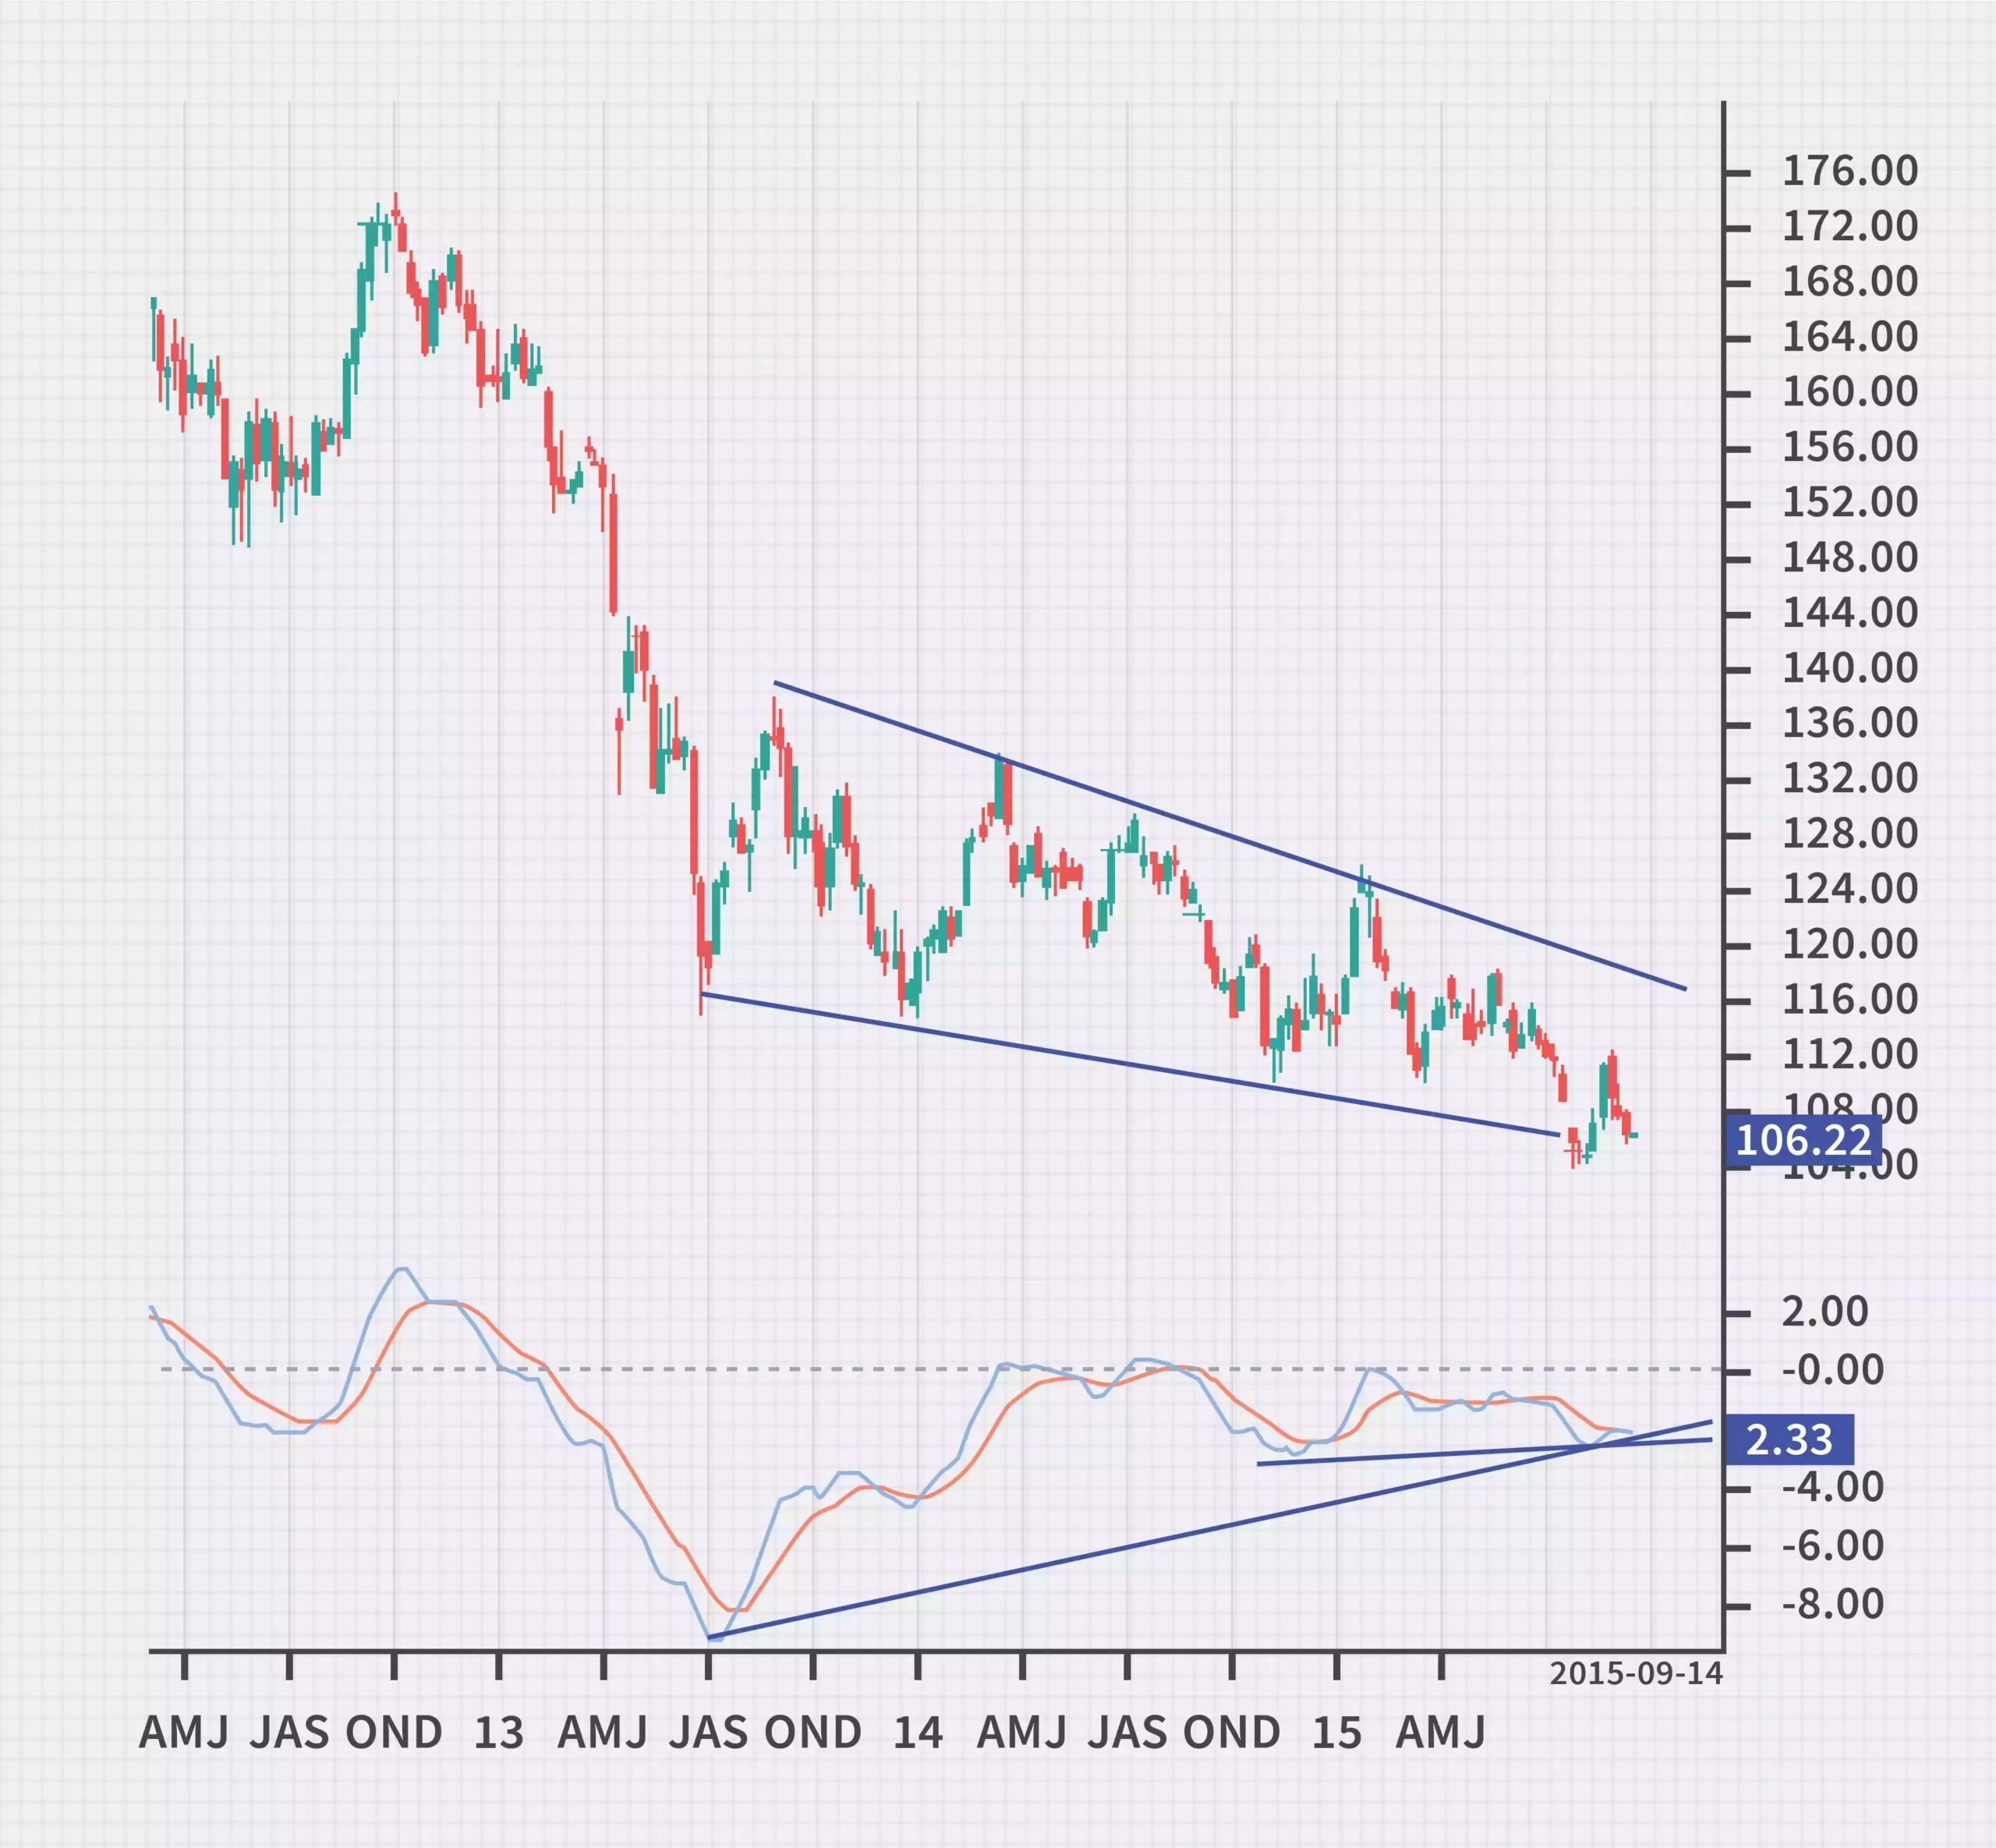
A bullish divergence occurs when the price makes lower swing bottoms, while the indicator makes higher bottoms. It aims to show that sales momentum is slowing down and that the downtrend is more reversible. In the graph below shows a bullish divergence. The bottoms in the MACD are rising while the price continues to fall. Despite the differences between mid-2013 and the end of 2015, the price continued its downtrend.
Common problems with MACD divergence
With divergence, one of the main problems is that it often shows a possible reversal, but no real reversal occurs – a false positive. The other problem is that the divergence does not predict all reversals. In other words, it predicts too many reversals that do not happen and insufficient real price reversals.
We will look at how to deal with these issues in the next section. False positive reversals are caused by these two common causes – which just about always occur in certain situations, but don’t necessarily cause a reversal.
When there is a sharp movement, the divergence will always occur (large movement for a short period of time), followed by a smaller sharp movement. This is actually what the deviation aims to capture, as many traders believe that if price movements slow down, it is ready to reverse.
The chart below shows that stocks are falling higher and then accelerating upwards. This rapid and enormous price move caused the MACD to leap , and because the price couldn’t still rise, a divergence arose. The divergence in this case does not show a reversal, just the movement of the price is slower than the movement of the price (higher difference), which caused the jump of the indicator. The gap caused an unusual jump in the indicator, so that with the return of the price to a more “normal” behavior, there is a divergence. Each price wave of a trend is different and not all price waves will move fast in a very short period of time. In this case, the worth jump was followed by a slower rise in prices, which led to a decrease in MACD readings, but not a reversal.
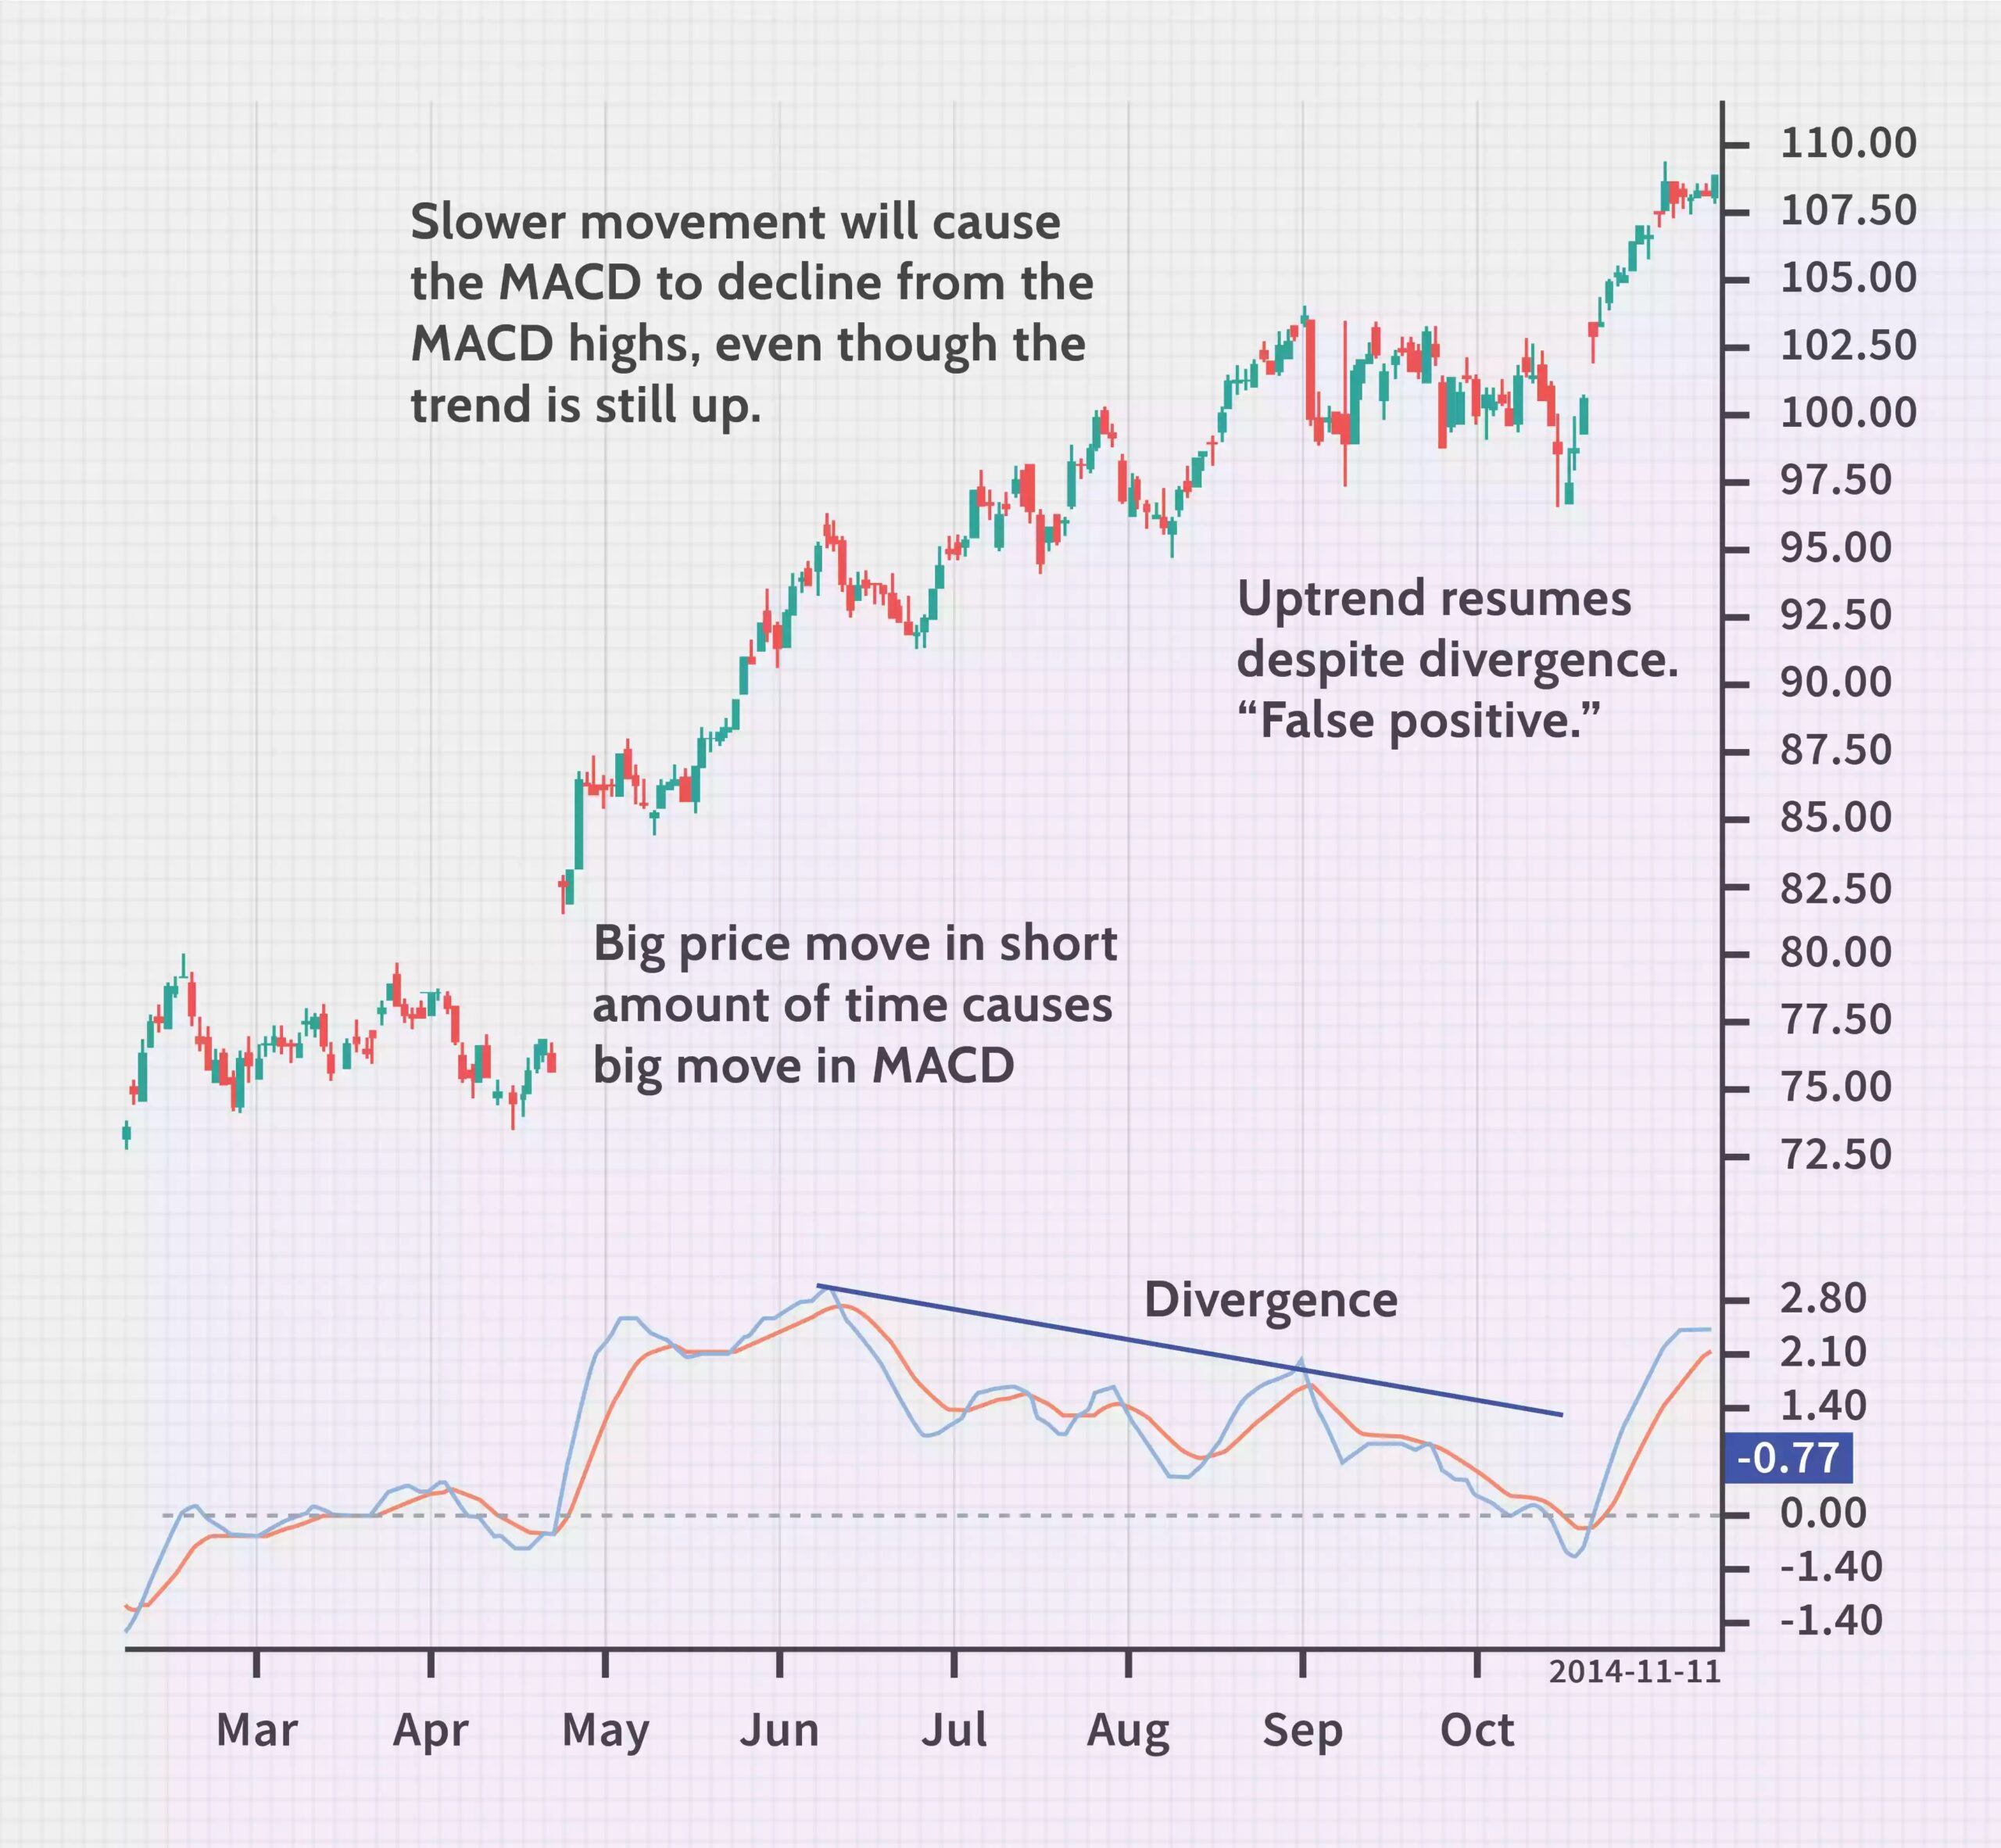
After a significant price movement, the value movement that follows will nearly always be slower (covering a shorter distance or covering for a shorter period of time), although the trend should be in effect.
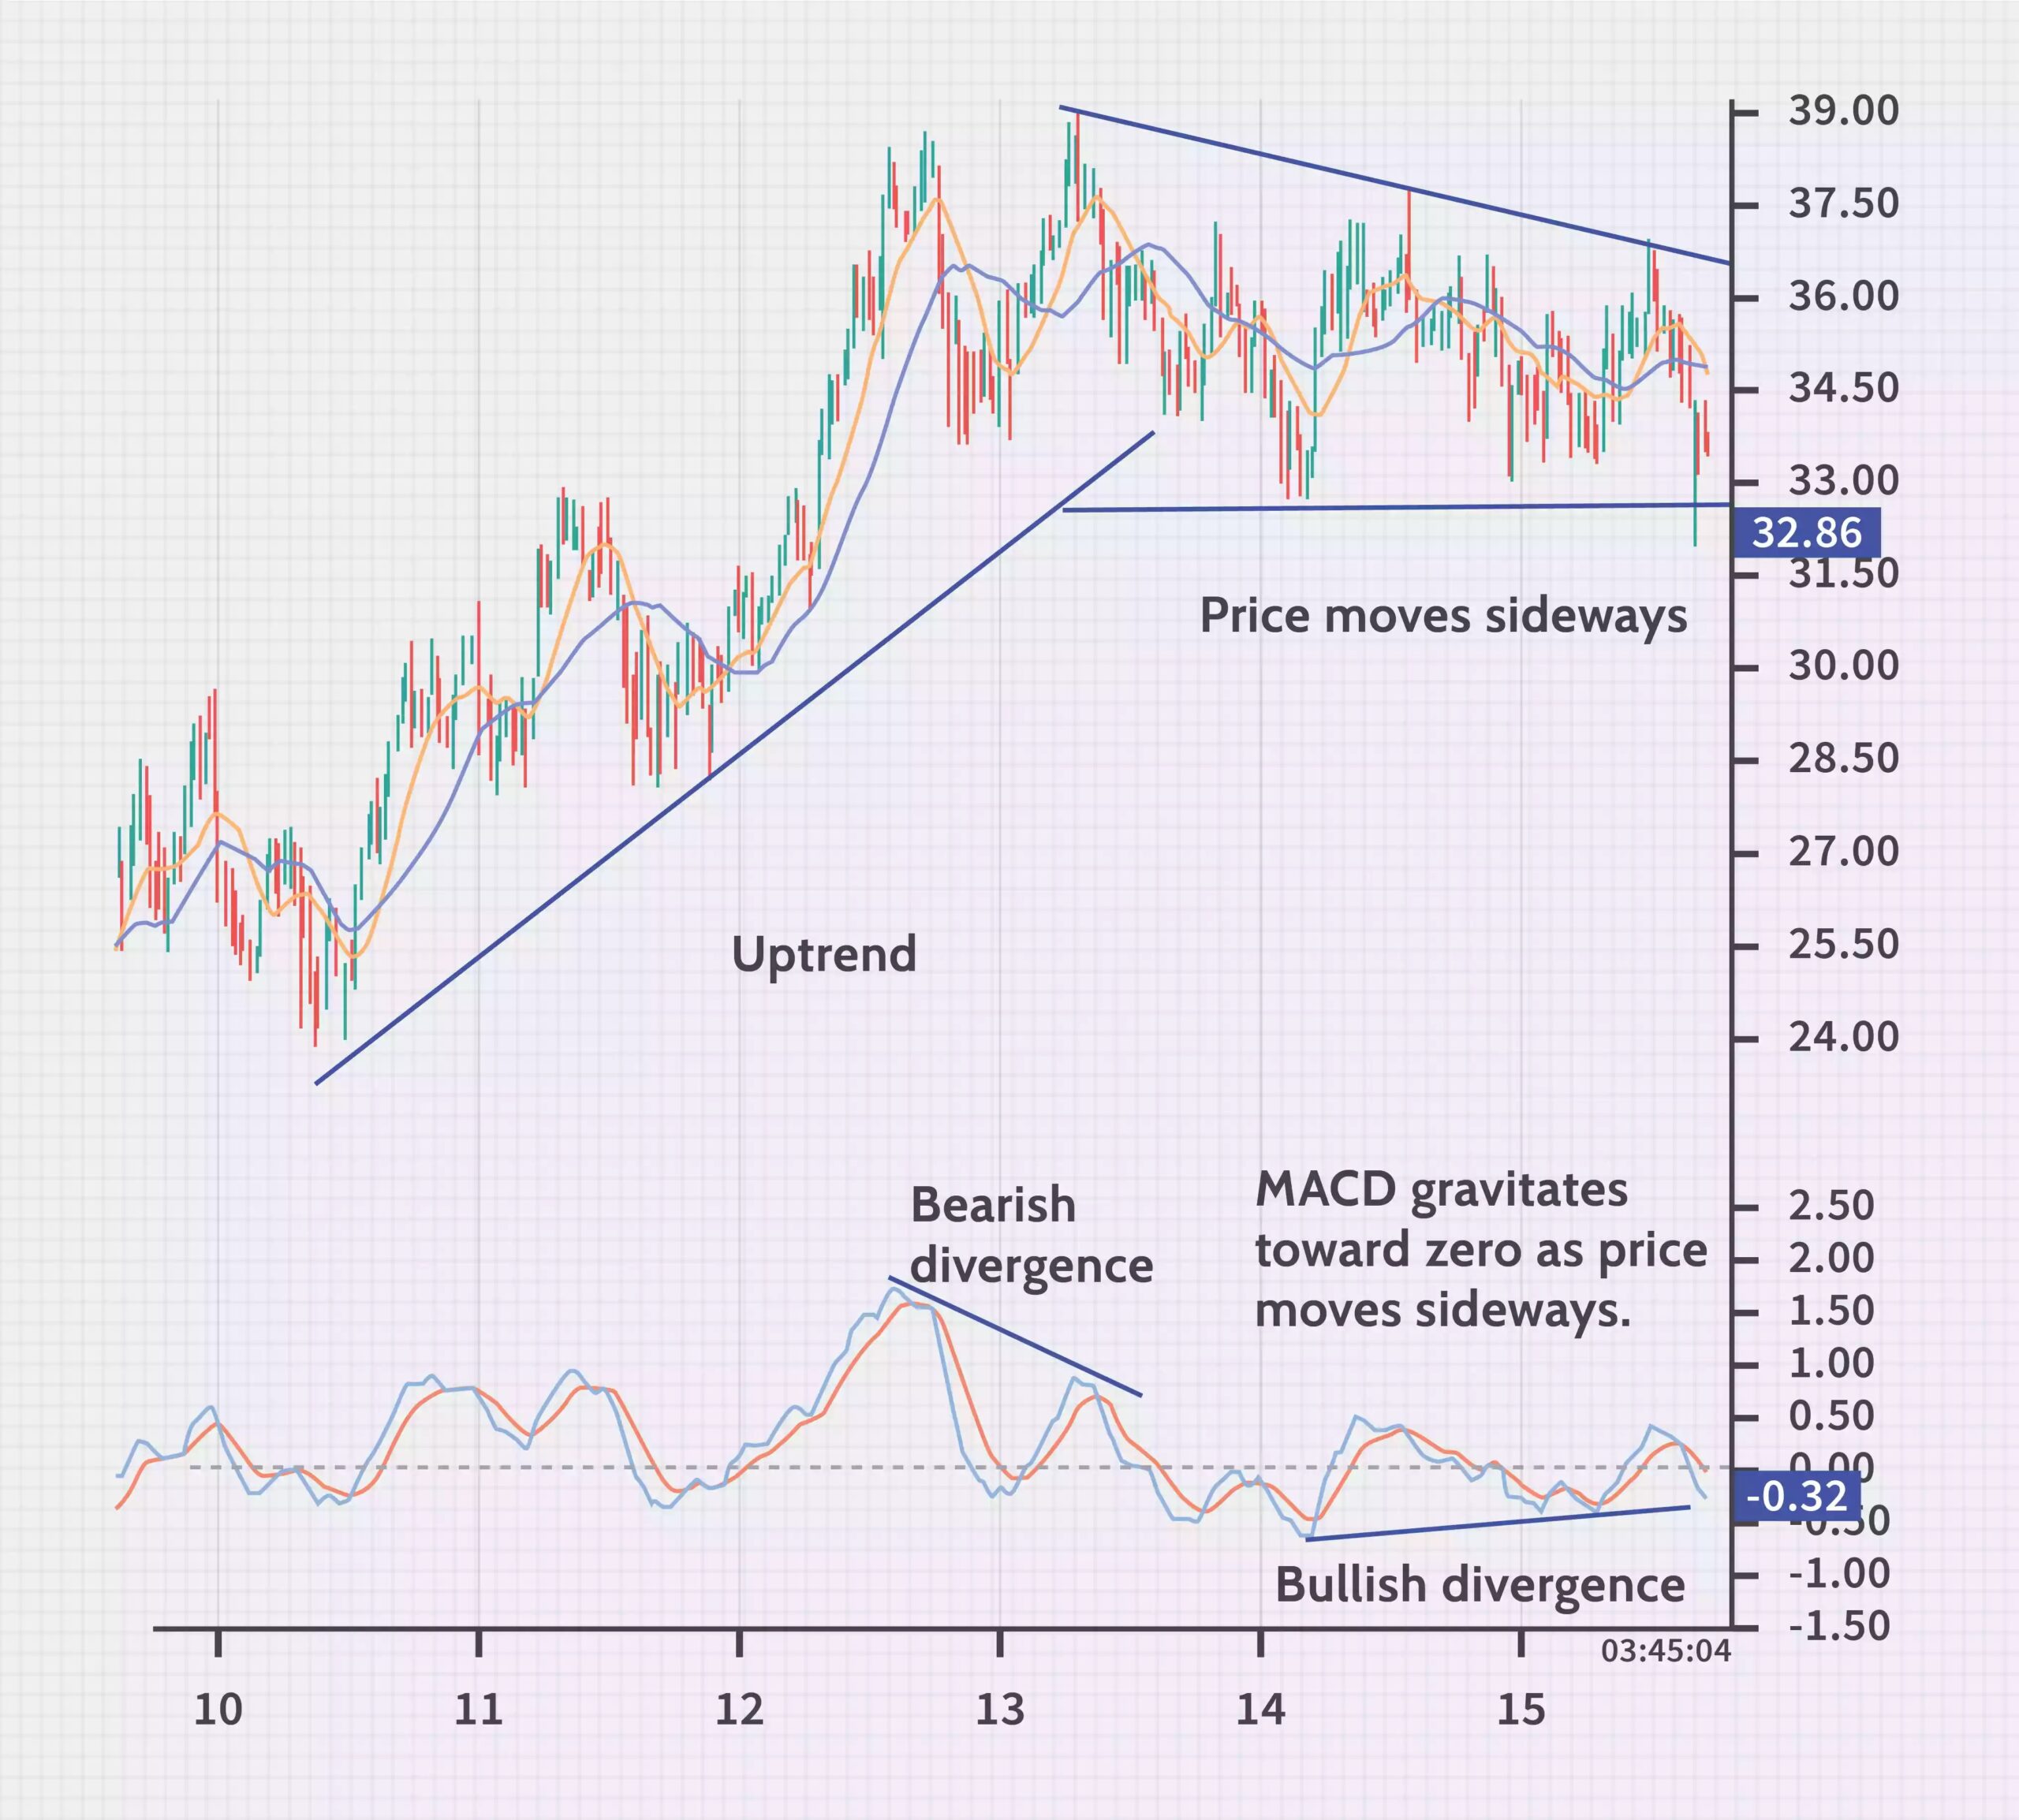
When the value moves sideways often occurs a “false positive” divergence, such as during a variety pattern or a triangle following a trend. As discussed earlier, the slowdown (sideways movement or slow trend movement) within the price will cause the MACD to maneuver faraway from its previous extremes and gravitate towards the zero line.
When the value moves sideways the MACD gravitates to the zero line, because the distance between the 26-period moving average and therefore the 12-period moving average — what the MACD measures — narrows. Moving averages (shown below) have a much harder time moving away from each other when the price moves sideways. The signals that MACD can provide while this is often happening are deteriorating because moving averages – what the indicator is predicated on – aren’t working well in volatile or side markets. (Moving averages tend to figure better in trends.)
Because the MACD will almost always gravitate to zero and is likely to move away from previous extreme MACD highs or lows when the price moves sideways, the MACD will almost always show a divergence. Usually these signals will be of little use because the MACD just flutters around the zero line while the moving averages swing back and forth.
After discussing some of the potential MACD issues and what to look out for, here are some ways to improve MACD differences using cost-benefit analysis.
Always utilize price action with divergence
Price is the ultimate indicator, as momentum indicators simply manipulate price data. Use pricing actions to help you make decisions when using MACD.
Here are some basic guidelines for this:
- Expect to visualize a MACD divergence when the worth movement slows (relative to previous price waves) or moves sideways. This is not necessarily an indication of a reversal.
- If there is a divergence, do not exit the current trade just because of it. For example, if the stock is on an uptrend, don’t go out of long trading just because there are differences. As shown, the divergence is not a good indicator of time and may not lead to a reversal at all.
- If you would like to trade on a divergence basis, await the worth to interrupt the present trend, confirming the divergence before acting. For example, if the trend is up, but there is a bearish divergence, go short only after the price gets out of the uptrend and moves in a downward trend. In an uptrend, the price should make lower swing peaks and lower swing bottoms to indicate a new downtrend. To reverse the downtrend, the price must make higher swing peaks and higher swing lows.
- Trust the price action more than the divergence. If the price goes out of a previous trend, heed the warning, even if the divergence is not present during the reversal.
Even with these guidelines, divergences can provide useful information for some positions, but not for others. This is a tool that can help trade, but is not perfect. An understanding of weaknesses and support for compensation by analyzing price actions is required.
The bottom line
Using indicators or divergences is not a bad thing. Divergence shows that the price loses momentum compared to previous price fluctuations, but this does not necessarily mean a reversal of the price. Divergence also does not have to be present to reverse the trend. The divergence nearly always occurs when the worth makes a pointy movement within the direction of the trend then moves sideways or continues to maneuver , but at a slower pace. The sharp movement followed by consolidation is usually a symbol of the strength of the trend instead of a reversal, because the MACD divergence suggests.
When using a divergence, find out what is causing it so you can avoid some of the divergence issues. Analyze the price action; the slowdown in the trend is visible without the use of the indicator, as well as the reversal of prices. If you utilize divergence, test its validity to support your entry and exit points for a period of several months to visualize if the divergence improves your results or not.
Disclaimer: The publications on this platform aim to provide useful information on financial topics. But they are NOT financial consultation or advice. Therefore they should not be used as a recommendation for making an investment decision on any type of financial products and services. We use in-depth research in the field but do not guarantee the completeness of the published materials. Always consult a specialist in your particular situation. "Applications In Life" Foundation is not responsible for any adverse consequences resulting from actions taken based on the information provided on the platform.