This publication aims to help fulfil the mission of “Applications In Life” Fondation to support and develop accessible and understandable financial education by improving financial culture and forward-thinking mentality of the civil society.
Divergence is one of the most effective trading concepts that offer reliable high-quality trading signals. The most interesting thing is that it owes its accuracy to the lagging action of the oscillators.
Differences are a big part of many traders’ strategies. Some use them to identify useful entry points, others to choose an appropriate time to exit their positions. In this tutorial, we will tell you how to recognize and trade these cross-functional trading patterns.
Divergence: definition
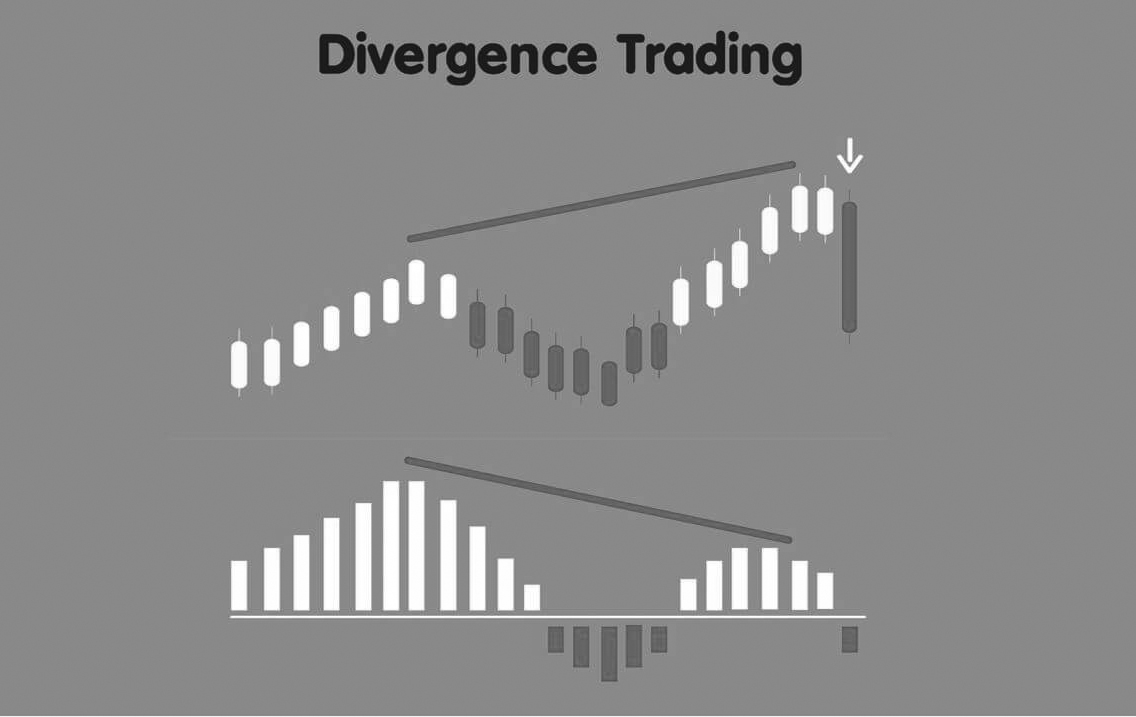
Let’s start by identifying what divergence is. In principle, divergence means that the price chart and the technical indicator (oscillator) you use to analyze the market are going in opposite directions. This is the first signal for you to understand that “something” is happening in your chart.
There may be a divergence between the price of an asset and almost any technical or key indicator or data. However, divergence is usually used by technical traders when the price moves in the opposite direction to the technical indicator.
What does divergence tell you
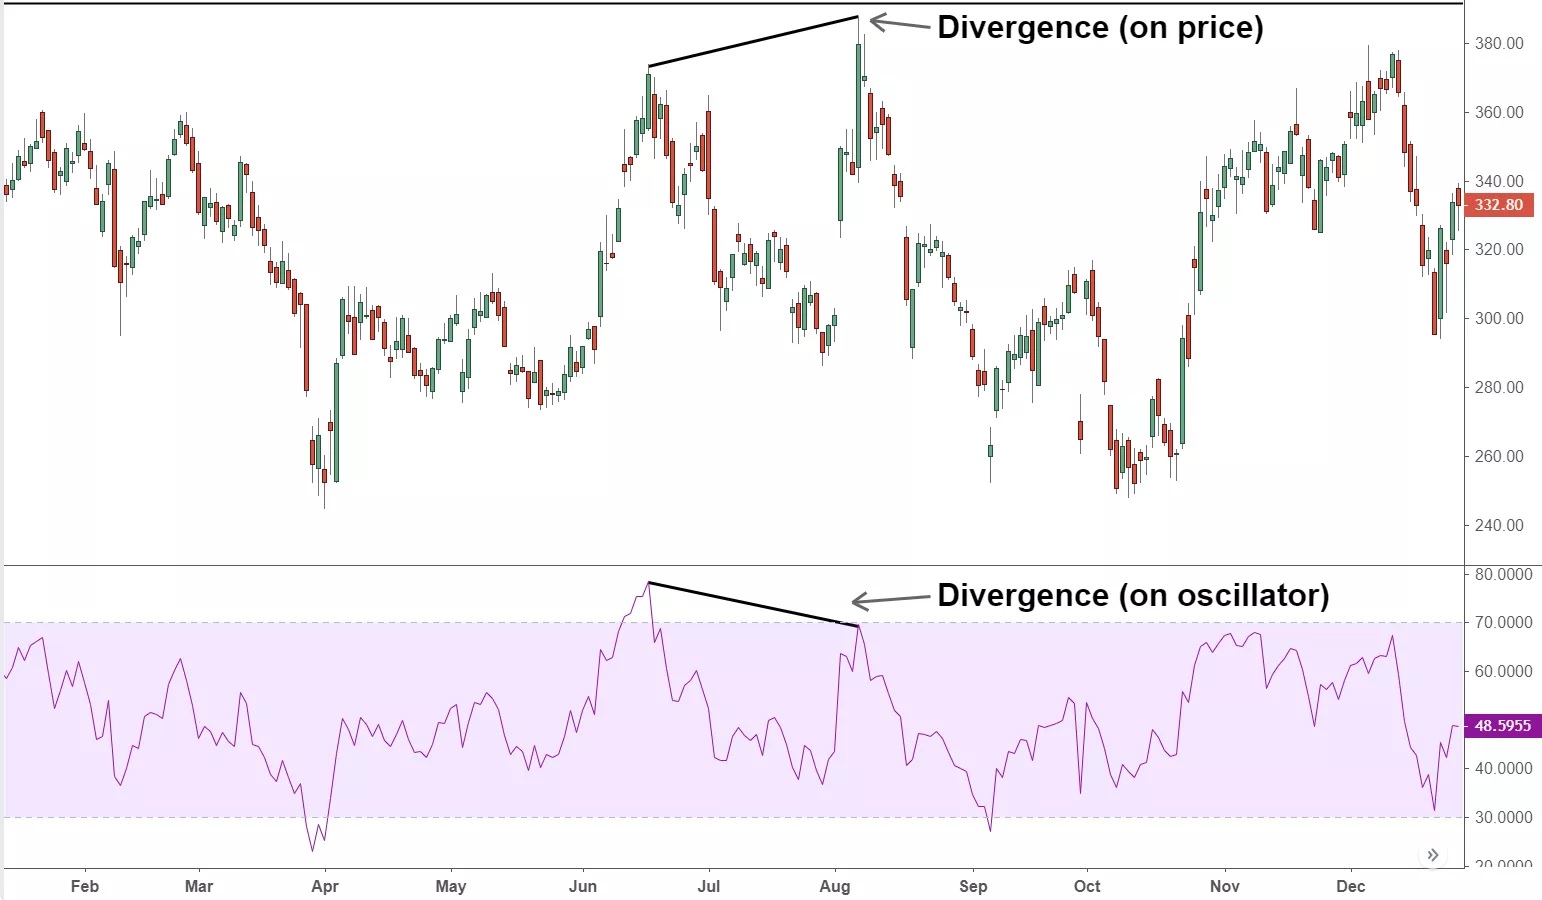
The divergence in the technical analysis can signal a large positive or negative price move. Positive (bullish) divergence occurs when the price of an asset makes a new bottom, while an indicator, such as cash flow, begins to rise. Conversely, a negative (bearish) divergence is when the price makes a new high, but the analyzed indicator makes a lower high.
Or in other words: divergences can be bearish or bullish.
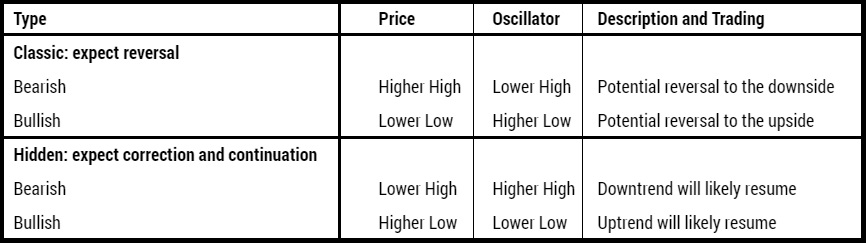
Bearish divergence occurs when the price creates higher peaks on the chart, while your indicator makes lower peaks. After such bearish divergences, prices usually move down: the price must catch up.
Bullish divergence occurs when prices create lower lows on the chart, while your indicator shows higher lows. It is also called “convergence”. This is the first indication that prices will soon rise: the price must catch up with the higher rate.
Keep in mind that when we talk about bearish divergences, we are looking at the peaks in the price chart. When we talk about bullish divergences, we are talking about lows.
Traders use divergence to estimate the main momentum in the price of an asset and to estimate the probability of price reversal. For example, investors can plot oscillators, such as the relative strength index (RSI), on a price chart. If stocks rise and reach new highs, ideally RSI also reaches new highs. If stocks reach new highs, but the RSI starts to make lower highs, this warns that the upward trend may weaken. This is bearish (negative) divergence. The trader can then determine whether he wants to exit the position or set a stop loss in case the price starts to decrease.
Bulish (positive) divergence is the opposite situation. Imagine that the stock price makes new lows, while RSI makes higher lows every time the stock price fluctuates. Investors may conclude that lower stock price lows are losing their downward momentum and a reversal may soon follow.
In addition to the classic divergences, there are also the so-called hidden divergences.
Hidden bearish divergences occurs when the price creates lower peaks on the chart while your indicator makes higher peaks. The lack of new peaks in the price chart shows that the bulls are losing strength. Despite the higher maximum of the oscillator, the upward movement is probably a correction. In this movement we have an opportunity to sell at higher levels.
Hidden bullish divergences occurs when the price creates higher lows on the chart, while your indicator makes lower lows. The lack of new lows in the price chart shows that bears are losing strength. Despite the lower bottom of the oscillator, the downward movement is probably a correction. In this movement we have an opportunity to buy at lower levels.
Experience has shown that it is easier to notice classic divergences than hidden ones.
Divergences are usually used to predict price adjustments and reversals. They are likely to appear before the actual price action. This is something that makes them so effective and allows traders to enter into a deal at the very beginning of a new emerging price movement.
The difference between Divergence and Confirmation
Divergence is when the price and the indicator tell the trader different things. Confirmation is when the indicator and the price or multiple indicators tell the trader the same thing. Ideally, traders want confirmation of entering into trades while they are in trades. If the price moves up, they want their indicators to signal that the price is likely to continue.
How to trade a classic divergence
To trade divergences, you need to insert one of the oscillators into your chart: Stochastic, Relative Strength Index (RSI), Moving Average Convergence Divergence (MACD).
Regardless of the indicator you choose, we recommend that you always place Stop Loss orders before placing your positions. It’s no different when you trade divergences. You can place a Stop Loss above the last peak of the chart, which confirms the appearance of bear divergences. If the divergence you are dealing with is upward, you should place Stop Loss below the last bottom of the chart.
To find a place for your Take Profit order, you will probably need an additional indicator (especially if you trade RSI and Stochastic). You can use swing analysis or support / resistance levels to adjust Take Profit. However, if you prefer to use MACD while trading with divergences, then you can fully rely on this indicator alone, without additional trading tools. When the MACD histogram crosses the signal line upside down, it is a signal to close the bullish position. When the MACD histogram crosses the signal line from the bottom up, it is a signal to close a bearish position.
Here is an example of trade divergence with a MACD oscillator.
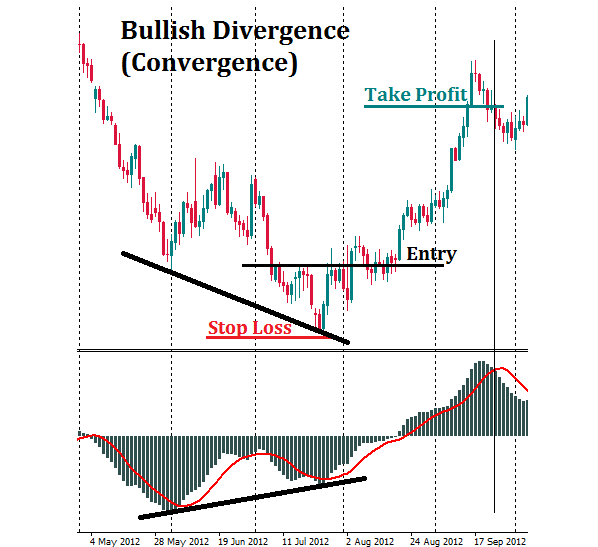
Suppose you find an upward divergence (convergence) between the MACD and the price chart. You also notice a bullish crossover in the MACD window. To open a long position, you use this price divergence as a signal. A Stop Loss order must be placed below the last bottom of the price. Close your trade when the bearish crossover of the MACD oscillator is formed.
Limitations of using divergence
As is true of all forms of technical analysis, investors must use a combination of indicators and analysis techniques to confirm the reversal of the trend before acting solely on divergence. Divergence will not present in all price reversals, therefore some other form of risk control or analysis must be used together with the divergence.
Also, when a divergence occurs, it does not mean that the price will reverse or that a reversal will soon occur. The divergence can last a long time, so the impact on it alone can mean significant losses if the price does not react as expected.
Disclaimer: The publications on this platform aim to provide useful information on financial topics. But they are NOT financial consultation or advice. Therefore they should not be used as a recommendation for making an investment decision on any type of financial products and services. We use in-depth research in the field but do not guarantee the completeness of the published materials. Always consult a specialist in your particular situation. "Applications In Life" Foundation is not responsible for any adverse consequences resulting from actions taken based on the information provided on the platform.