This publication aims to help fulfil the mission of “Applications In Life” Fondation to support and develop accessible and understandable financial education by improving financial culture and forward-thinking mentality of the civil society.
Ichimoku or Ichimoku Kinko Hyo (IKH) is a informative and very useful technical indicator. Its name is translated from Japanese as “look at a chart in equilibrium”. The main idea of it is that you will learn everything you need to know about the state of the market with just one look at a chart containing this indicator.
The Ichimoku indicator performs several important tasks:
- marks the direction of the dominant trend;
- shows momentum and strength of a trend;
- provides reliable support and resistance levels;
- gives trading signals.
This indicator may seem confusing at first, but when you know it, you will find it quite simple and invaluable in market analysis.
In the following text, we will tell you about the elements of Ichimoku and the signals they produce. You will learn how to analyze the market with this technical tool.
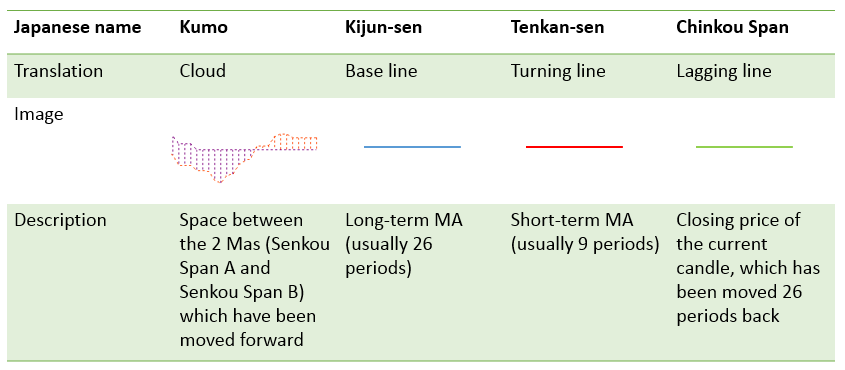
Ichimoku elements
The indicator is based on moving averages, which have some modifications. The lines have traditional Japanese names as well as conventional modern ones.
Take a look at the example of the Ichimoku indicator on the chart. We can distinguish the three layers – past, present and future.
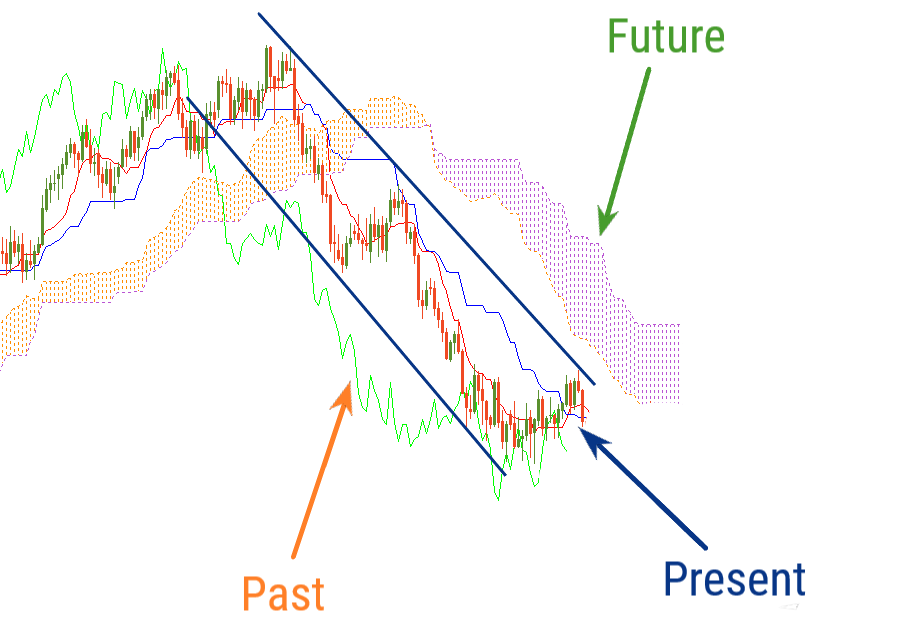
‘Present’ of Ichimoku indicator
Let’s start with the so-called “present”. It is characterized by 2 lines – Kijun and Tenkan. Of these two, Kijun (baseline) is a moving average with a longer period. It measures medium-term momentum and has more weight than Tenkan, as a result. The price crosses Tenkan more often than Kijun and if the price crosses Kijun, it signals changes in the market.
‘Future’
The “future” is represented by the Ichimoku cloud. The cloud is formed by the 2 moving averages, which move forward. If the moving average with a longer period (Senkou Span B) is below the moving average with a shorter period (Senkou Span A), the Cloud is considered bullish. Its color is usually light. If Senkou Span B is above Senkou Span A, the Cloud is considered a bear. Such a cloud often has a darker color. Bullish Cloud means that buyers dominate the market, while Bear Cloud shows that sellers have control. You can see that the Cloud changes color from time to time, reflecting the shift in strength from bulls to bears and vice versa. The width of the cloud matters: the wider the bear cloud, the stronger the sellers. To understand the current power balance of the market, look at the part of the cloud that is “in the future”, ie. to the right of the current price. As for the part of the Cloud that is in line with current prices, it acts as a support and resistance to the price.
‘Past’
There is a line in the “past” called Chinkou Span. Unlike other Ichimoku lines, this is not a moving average, but simply a price chart moving a number of periods back so that it lags behind the market. The way this line interacts with the price chart itself offers advice to traders.
Why do some elements of the indicator switch forward and some go back? First, it would be very difficult to read the diagram if all 5 lines were in the same area. In addition, in this way, the elements of the Ichimoku indicator produce trading signals. The following lesson will show you how to interpret these signals.
How to implement Ichimoku
You can add Ichimoku in Metatrader to a chart by clicking “Insert”, choose “Indicators”, and pick “Custom”, then “Ichimoku”. You can choose values for Tenkan, Senkou Span B and Kijun, in the settings. According to your taste, you can also adjust the colors the indicator’s lines.
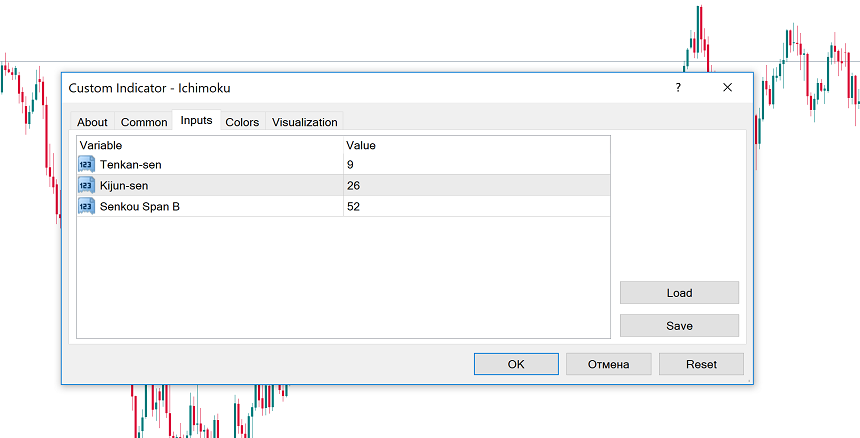
The default settings 9-26-52 are the original parameters suggested by the indicator developer. They are popular with retailers and can be used at any time. At the same time, you can also adjust the default settings. The main thing is to choose the increasing values so that the figure for Tenkan-sen is the smallest and the value for Senkou Span B is the largest.
Trading with Ichimoku
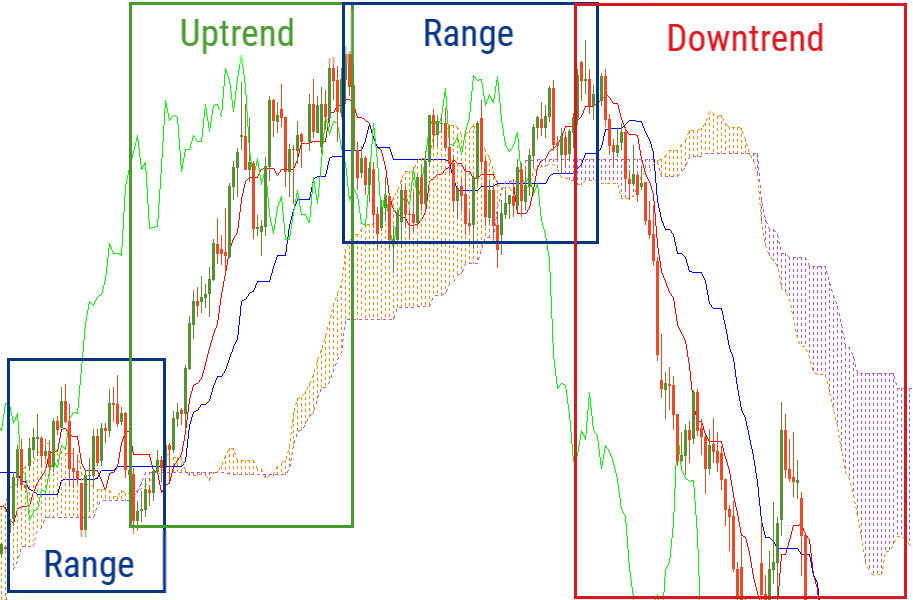
The position of the Ichimoku lines can give traders a clear idea of existing trends. When the market is aside, the indicator lines are horizontal, so the price fluctuates around them. The cloud is thin and often changes color.
If the price is above Cloud, Tenkan and Kijun and the bullish Cloud is solid, this is an uptrend. In this case, Chinkou Span will be above the price.
If the price is below Cloud, Tenkan and Kijun and the bearish Cloud is solid, this is a downward trend. Chinkou Span will be below cost in this case.
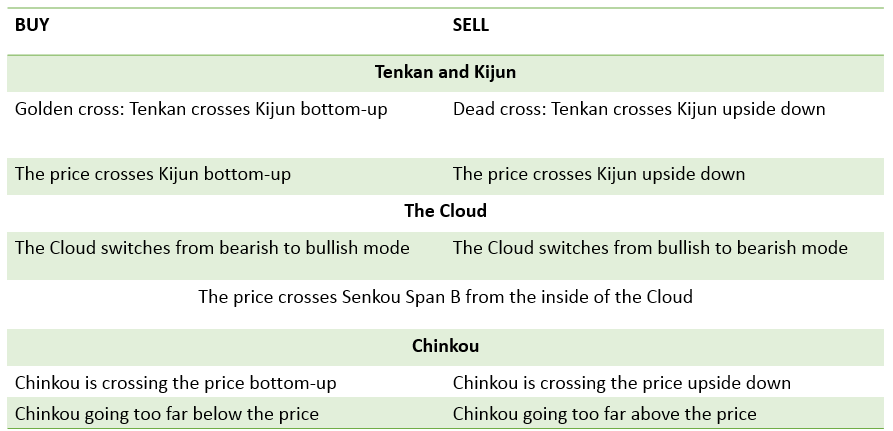
The Ichimoku lines produce trading signals by crossing with each other and the price, which is why there are many different signals in the table below. Note that when a new trend begins, signals from different elements of the indicator tend to appear at the same time and point in the same direction.
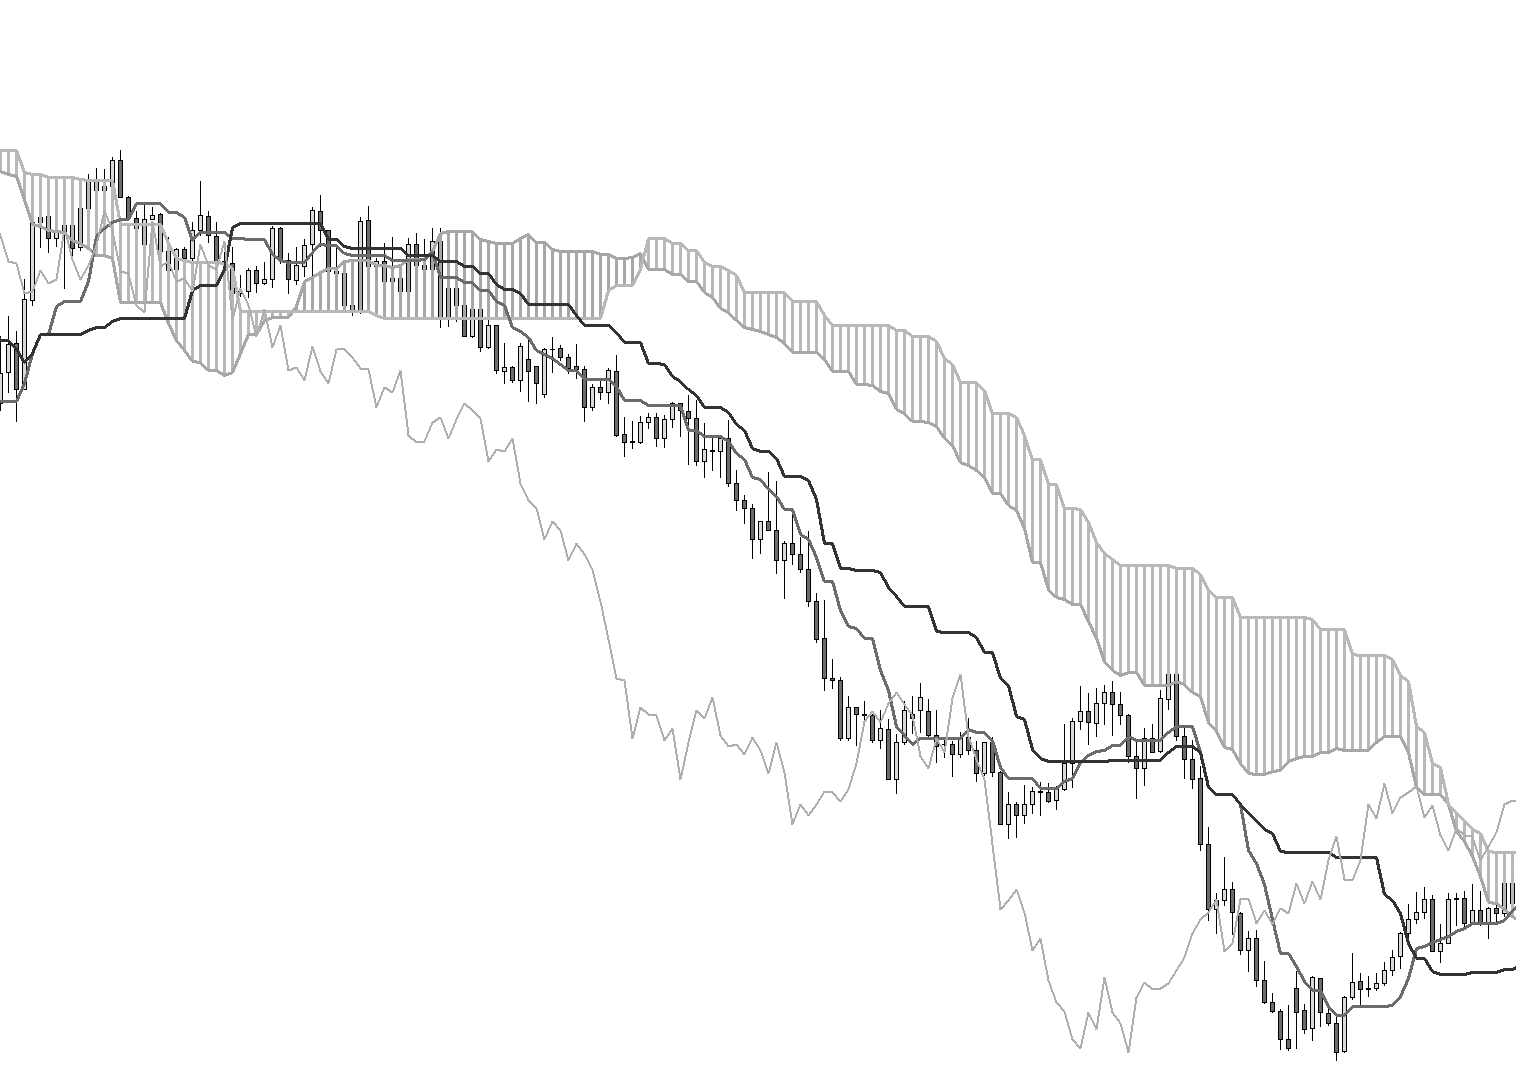
Let’s review an example of how Ichimoku provides trade signals.
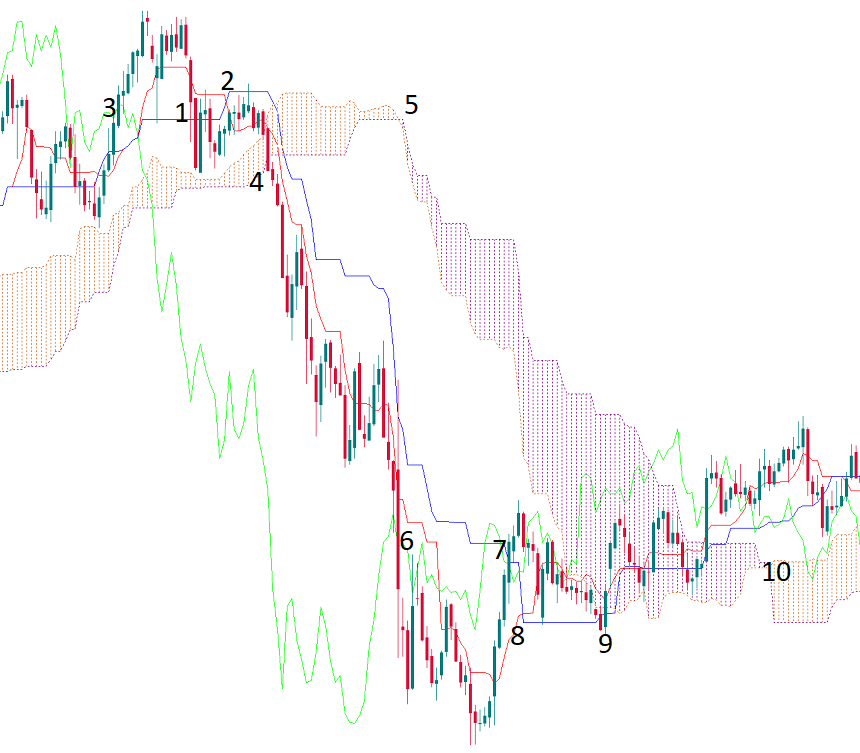
1 – The price fell below Kijun-sen. This is the first bearish signal.
2 – Tenkan-sen fell under Kijin-sen.
3 – Chinkou Span crosses the price chart down.
4 – The price broke under the Ichimoku cloud.
5 – The cloud passed from bull to bear.
Signals 2-4 appeared at the same time and signaled the beginning of a bearish trend. They indicate the possibility of opening a sale. The indicator lines then acted as a price resistance.
6 – Chinkou Span broke above the price chart. It is possible to take a profit from a short position.
7 – The price exceeded Kijun-sen.
8 – Tenkan-sen went over Kijun-sen.
9 – The thick bear cloud Ichimoku acts as a resistance to the price, but finally managed to break through.
10 – The cloud passed from swords to bulls. The price exceeded the cloud. There are indications of an emerging uptrend, although, given the fact that Chinkou Span is adjusting the price chart, there may be a sideways trend for some time.
Conclusion
The Ichimoku indicator is a complete trading system. It is possible to use only this trading indicator. You can use it to identify trends, check for support and resistance levels, and receive input signals. You can customize the indicator settings and use it with other technical analysis tools.
Disclaimer: The publications on this platform aim to provide useful information on financial topics. But they are NOT financial consultation or advice. Therefore they should not be used as a recommendation for making an investment decision on any type of financial products and services. We use in-depth research in the field but do not guarantee the completeness of the published materials. Always consult a specialist in your particular situation. "Applications In Life" Foundation is not responsible for any adverse consequences resulting from actions taken based on the information provided on the platform.