This publication aims to help fulfil the mission of “Applications In Life” Fondation to support and develop accessible and understandable financial education by improving financial culture and forward-thinking mentality of the civil society.
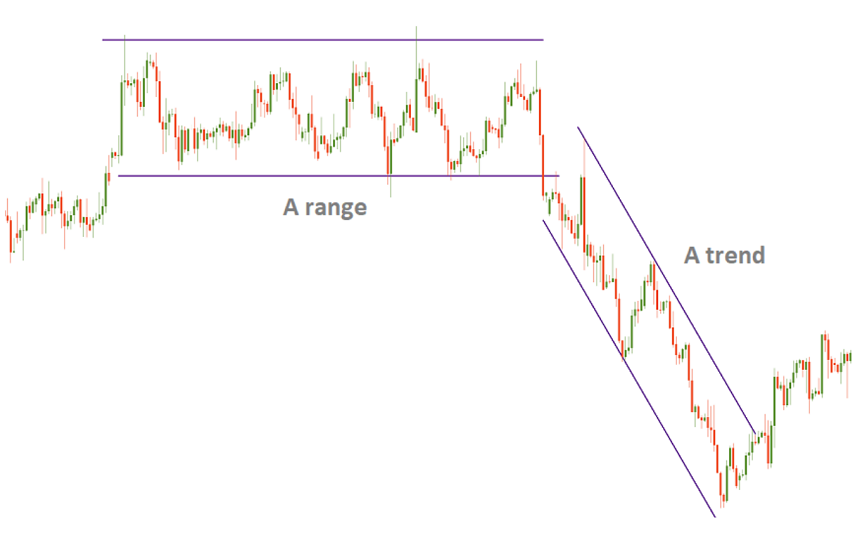
The market isn’t always the same. You need to understand the market’s condition, in order to choose the best trading strategy. There are two main types of market conditions: a range (price fluctuations in a horizontal channel) and a trend (a sustainable movement to the upside or to the downside).
It’s necessary to apply a strategy that fits the current condition of the market. If you use a trend trading strategy in a ranging market, you will likely lose money and, vice versa, if you use a range trading strategy, then you’ll lose money in trending markets. Identifying the market’s condition is what you always should start your technical analysis with, so that you could then pick an appropriate strategy.
It’s important to understand the underlying logic of trends and ranges.
First of all, keep in mind that as a result of supply and demand for the currencies which form a currency pair, the price moves. If there are more buyers of the euro than those of the US dollar, EUR/USD will tend to rise.
A price stays within a horizontal range when the powers of buyers and sellers are mostly equal. The market is in the situation of uncertainty, as usual: the majority of traders lack the information to join one of the camps.
New information appears, at some point and either bulls or bears manage to break the range and start the directional movement of the price. If this movement is sustained, we get a trend. There will definitely be periods of the so-called consolidations during a trend (i.e. ranges) and corrections (i.e. short trend moves) as market participants take profit and re-adjust their positions. On lower timeframes, these shorter moves may provide opportunities for range trading.
Ranges
When the market has no clear direction, range trading takes place. The price moves sideways when neither bulls nor bears are able to start a trend. Still, the absence of an downtrend or a uptrend is not a reason to refrain from trading. While the market is range-bound, it’s quite possible to achieve profit.
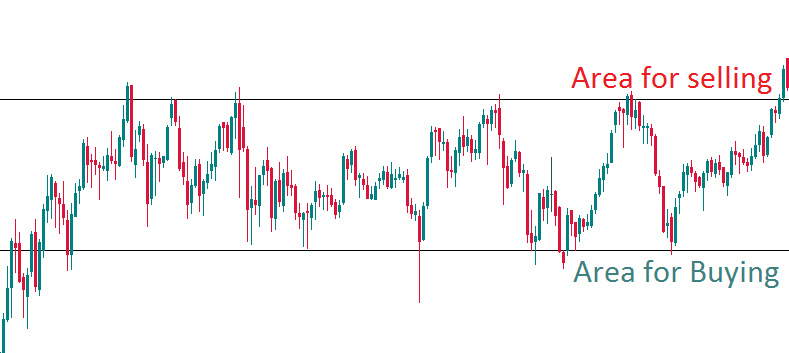
Range traders rely on the fact that prices will trade between the same horizontal levels for some time. They expect the price to bounce off both resistance and support repeatedly. The trader’s goal is to take advantage of price fluctuations within the range by selling at resistance and buying at support.
The major currency pairs ( USD/JPY, NZD/USD, EUR/USD, AUD/USD, GBP/USD, and USD/CAD) tend to trend more. Sometimes they can have periods of consolidation, but still are less suitable for range trading. Crosses (GBP/JPY, AUD/CAD, CHF/JPY, and EUR/GBP) spend more time in ranges.
How to trade in a range?
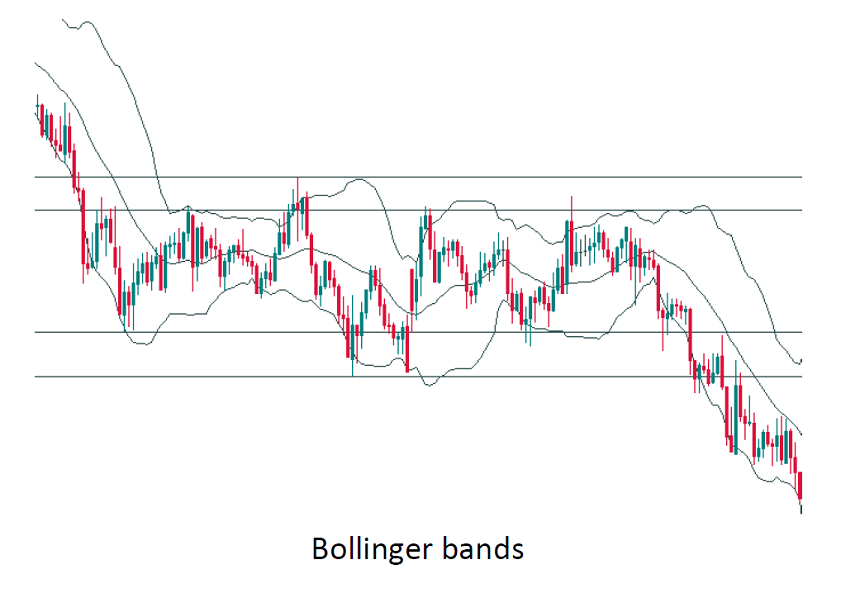
For a range trader, the first step is to find support and resistance or, in other words, define the borders of the range. You have to check the previous highs and lows of the chart, this is the simplest way to do that. If the highs align at a horizontal line and so do the lows, you might have found the resistance and the support areas. Of course, in reality, the highs aren’t positioned exactly at the same line and neither are the lows. However, the market is not making lower highs and lower lows that point at a downtrend (or higher highs and higher lows typical for an uptrend). You can help yourself to track the borders of the range with Bollinger bands as they represent dynamic support and resistance that limit it.
The second step is to track overbought and oversold states of the price. The idea is to buy when it becomes oversold (at support) and sell when a currency pair is overbought (at resistance). To identify overbought/oversold conditions, traders use a type of technical indicators called “oscillators”. Such indicators rotate around a central level.
- The pair is overbought, when an oscillator rises from a central line and reaches an extreme area on the upside. It’s time to sell, if the pair is at the time near the resistance zone, .
- The pair is oversold, when an oscillator falls from a central line and reaches an extreme area on the downside. It’s time to buy, if the pair is at the time near the support zone.
The most popular oscillators are Stochastics, RSI and CCI. The most sensitive to price action, seems to be Stochastics.
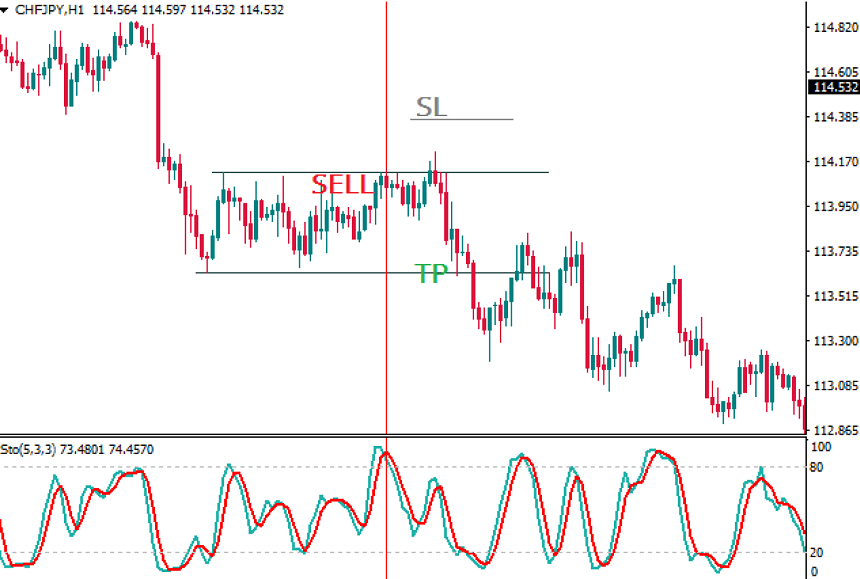
The trigger for entering a trade is to sum up, the price’s getting to one of the range’s borders and the signal from an oscillator. If there’s a reversal candlestick pattern near the resistance/support, the probability of a successful trade will be higher.
Risk management
It’s a necessity always to limit trading risks. The main risk in range trading is that the range is broken. A successful range trading strategy involves making small but consistent gains and minimizing losses.
When the market is not very volatile, range trading is good option for traders. As a result, when volatility spikes, it’s not recommended to trade in ranges. News events can send the price far away in one direction. As a result, if you plan to do range trading, check the economic calendar to make sure that no important releases are scheduled for the currencies you have picked.
In range trading, the rules for Take Profit and Stop Loss are very simple. SL is set at about half the amplitude of the range, while TP is placed at the opposite side of the range. This provides preserving a 2:1 reward to risk ratio while at the same time you have ample room for a drawdown . It’s not recommended to scale out or scale in of a position. Firstly, adding to a position will unnecessarily increase your risk exposure. Secondly, there’s no real point in trying to fully or partially close the trade as the TP is not that far away.
How to identify market reversal?
Every trader needs to understand trends well, because the trend is a major state of the market. There will always be a moment when the trend you are trading reverses and a new trend starts, no trend will last forever.
Technical analysis can tell a trader whether a trend is close to changing its direction or confirm that a reversal has indeed happened.
The trader must know about an upcoming reversal for two reasons. Firstly, if a trader is already in a trade on a trend, he/she will need to close it before the reversal. Secondly, the reversal is a time when a new trend emerges. If you read the market correctly and spot it in time, you will get an opportunity to join the trade early and gain more.
The probability of a reversal mostly depends on the strength of the current trend: if a trend is weak, the reversal is more likely. There are several ways to estimate the strenght of a trend. We can recommend two tactics: visual analysis and technical indicators.
Visual analysis of a potential reversal
You need to be aware at the highs and the lows of a trend. If the corrections are short, and the consolidations develop in narrow ranges, the trend is strong. In a strong bullish trend, the price strictly respects the first support formed at the previous highs:
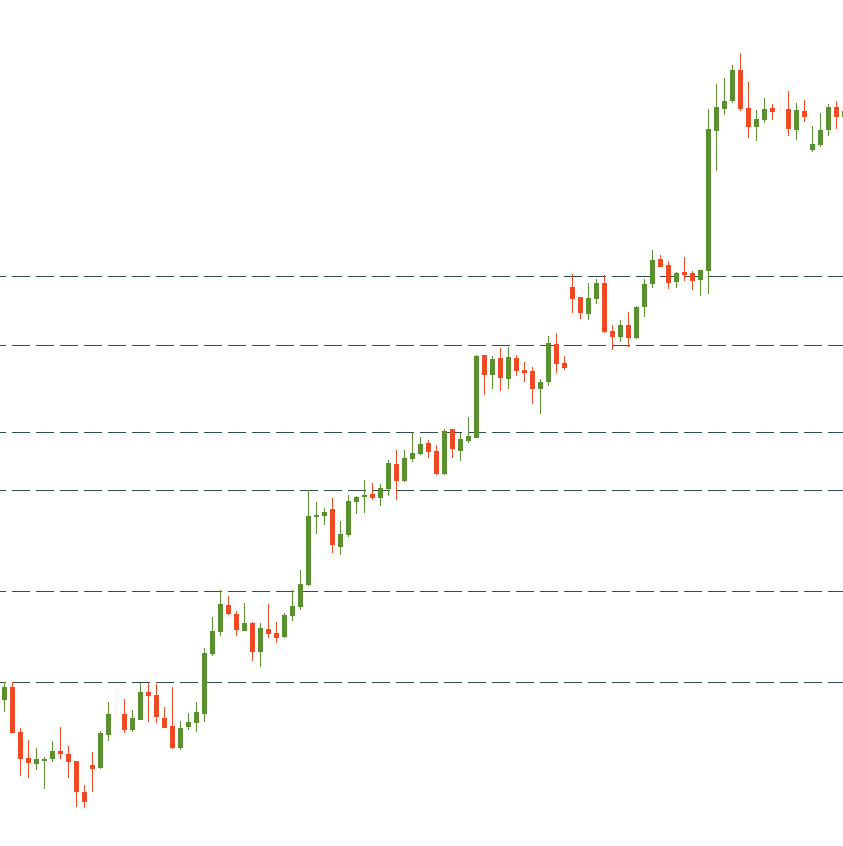
The price can fall below the previous high (the initial support) but holds above the previous low, in case of a slow uptrend.
By the presence of a lower high, a weak uptrend can be recognized. Traders will be afraid of the formation of the “Head and shoulders” pattern, in this situation and the potential reversal of the market to the downside.
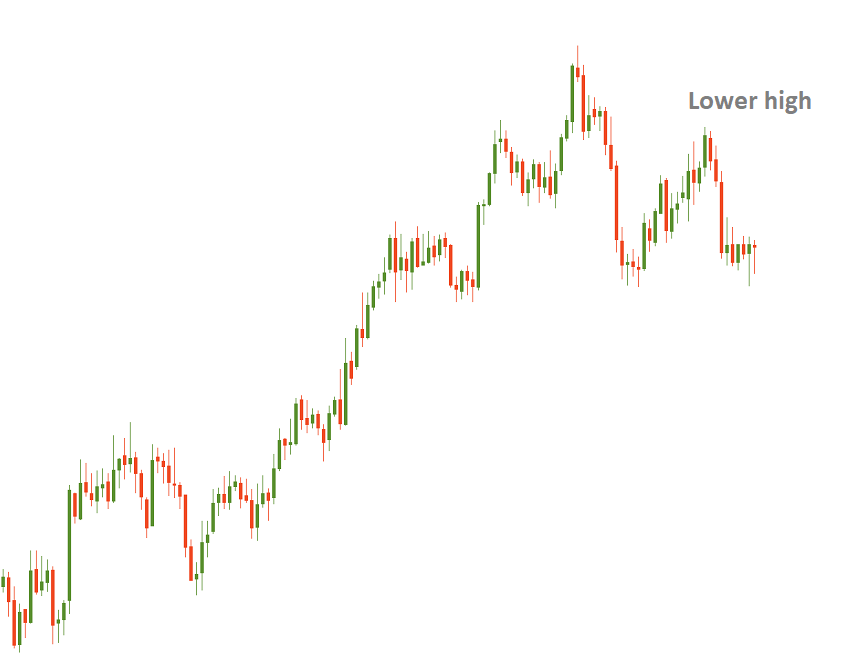
In addition, it is a hint the uptrend is getting weaker, when the price starts revisiting a support line too often.
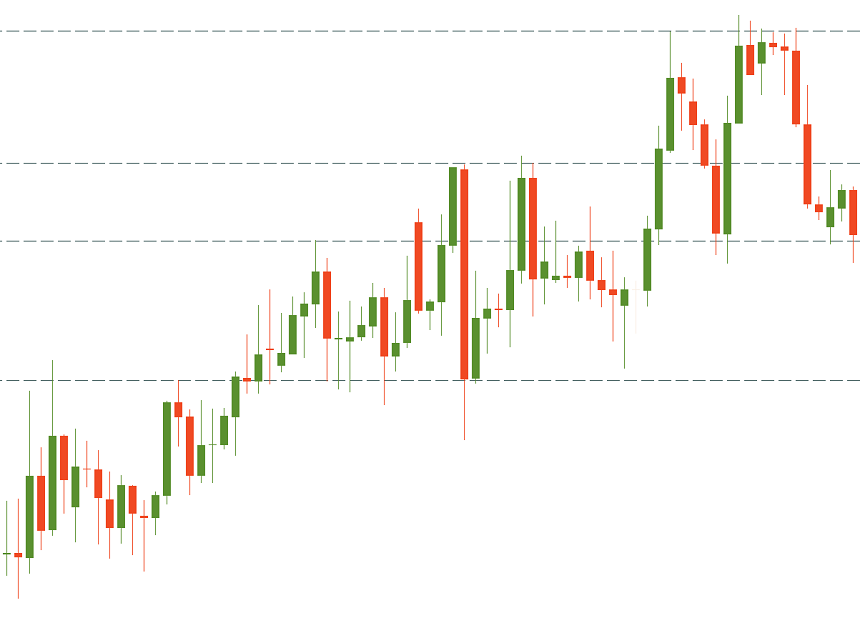
From the explanations above, you can see it’s necessary to distinguish between support #1 (previous high during an uptrend) and support #2 (previous low during an uptrend). A reversal happens when the price breaks support #2. Two situations are marked at the picture below. In the first case, the price has managed to stay above the second support. In the second case, it went below the second support and confirmed a reversal.
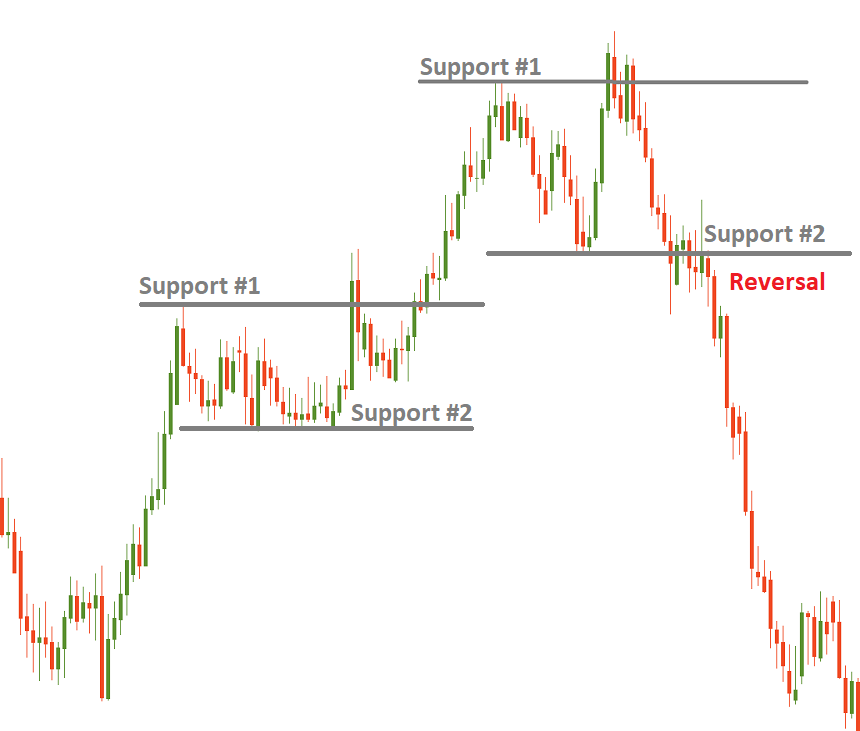
Notice that it’s very important to declare a reversal, or in other words, to confirm that the price did indeed break below support/above resistance. Let’s take a closer look at the Japanese candlesticks: the breakthrough candlestick should close below the support/above the resistance. An ideal situation is when the broken line is retested, but the price doesn’t return above/below it. Breakthrough confirmation may also come from technical indicators and volumes.
Indicators that can help you identify a reversal
For identifying a reversal, there is a number of technical indicators that may be quite helpful.
First of all, Moving Averages of various periods can either intersect sending the signals of a trend’s change or provide support/resistance levels beyond which traders will see a reversal. The Ichimoku indicator also has a set of lines which indicate when the market switches from the bullish to the bearish mode and vice versa.
Secondly, ADX is a leading indicator of a trend’s strength. When the trend is getting stronger the main line of the indicator rises . The ADX magnitude varies from 0 to 100. The trend is distinctive and strong, if the indicator is above 25. The moment when ADX rises above 25, it may be used as a confirmation of a breakout and trend reversal. The direction of the reversal may be shown by the two other lines of the indicator.
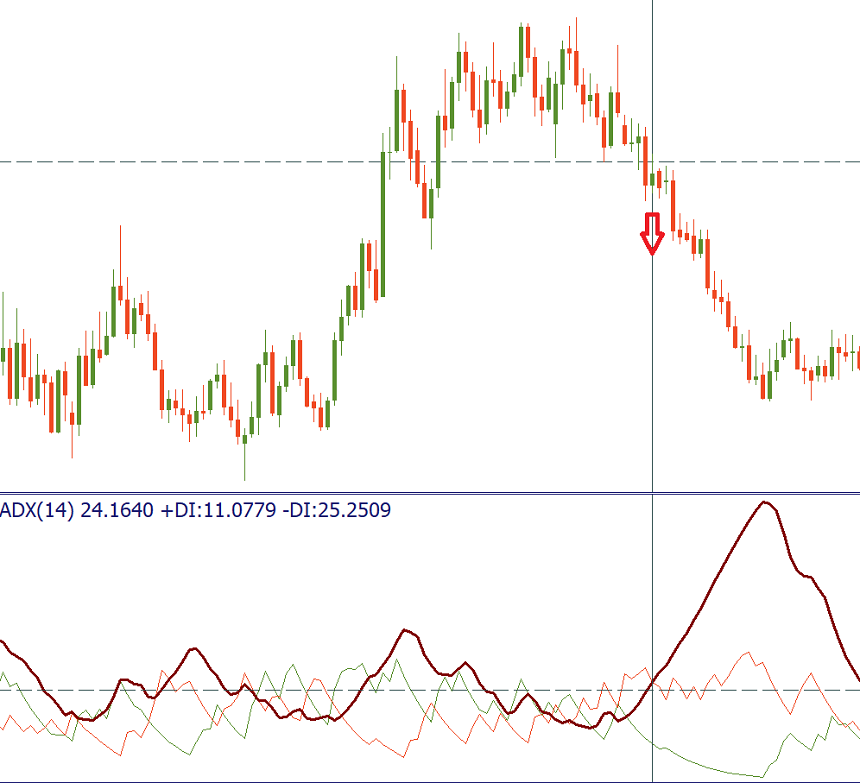
It’s also be helpful, if you monitor how ADX itself is trending. A reversal is less likely, if the indicator forms a series of higher peaks, the trend is strong.
You can also use volume indicators to estimate trend strength and confirm reversals. If a lower high was formed in an uptrend and the volume is lower as well, it’s a strong hint of a reversal to the downside.
Reversal or correction?
The reversals often start as corrections, this is the main problem. It’s often quite difficult, as a result to distinguish one from the other. In the table below we have assembled the information that will help you do that.
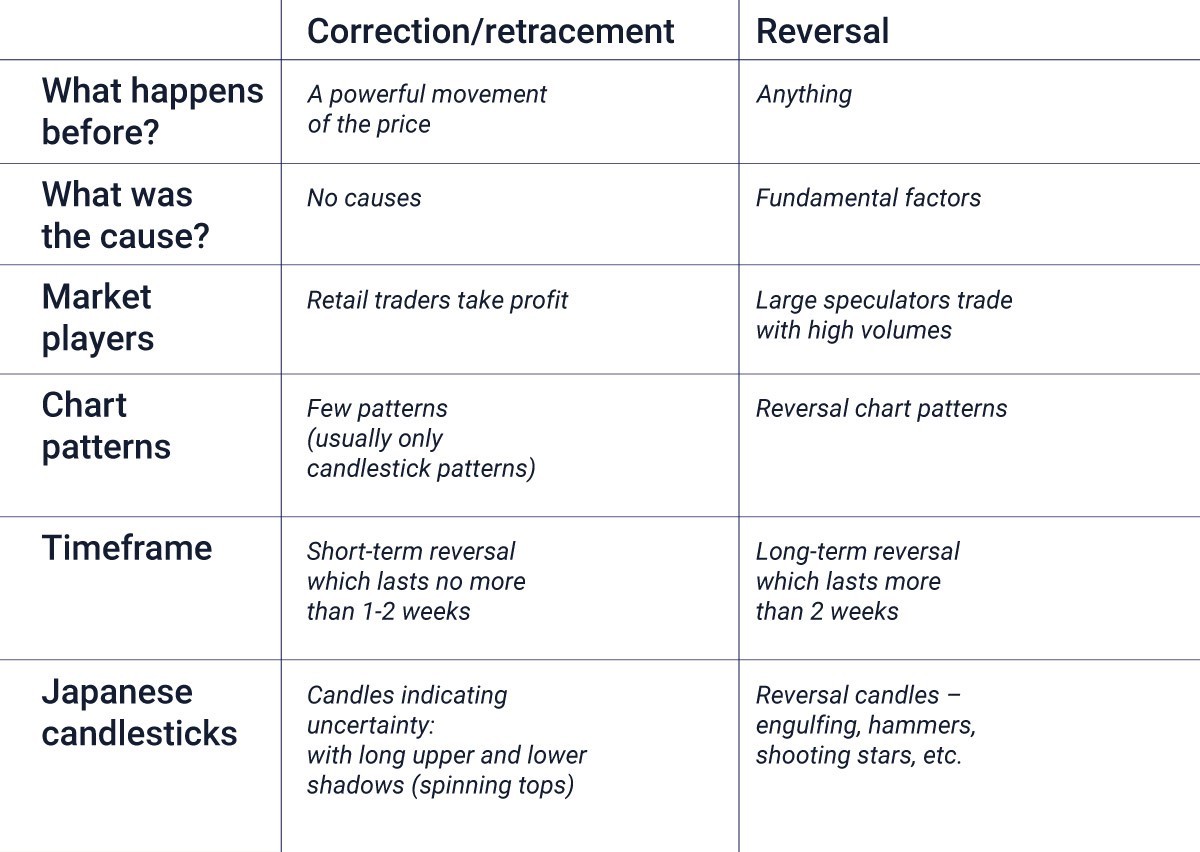
Notice that corrections are relatively short-term. Their nature is technical: corrections occur when the asset gets oversold or overbought as market players take profit after a move in line with the trend. To measure the depth of corrections, it might be helpful to use Fibonacci tools. When price retracement is contained by 38.5% Fibo, the current trend is fairly strong and there are no signs of a reversal.
Reversals, on the other hand, often caused by some fundamental reasons, represent a bigger change in the direction of the price action. The price goes beyond the key support/resistance of a trend, this is the key feature of a reversal. If the market goes beyond the 50% Fibonacci retracement level, this might be a reversal.
Conclusion
Range trading with it’s simple logic can be mastered even by beginner traders. At the same time, you need to keep in mind that while in range the market is in the situation of uncertainty. The borders of a range may be fluid and false breakouts may happen. As a result, this type of trading required disciplined risk management.
At the end, to increase the precision of your forecasts, we recommend you using several methods of analysis to determine reversals correctly. Notice that the described methods do not guarantee a 100% chance of success, so it’s necessary to abide by the rules of risk management when you trade reversals.
Disclaimer: The publications on this platform aim to provide useful information on financial topics. But they are NOT financial consultation or advice. Therefore they should not be used as a recommendation for making an investment decision on any type of financial products and services. We use in-depth research in the field but do not guarantee the completeness of the published materials. Always consult a specialist in your particular situation. "Applications In Life" Foundation is not responsible for any adverse consequences resulting from actions taken based on the information provided on the platform.