This publication aims to help fulfil the mission of “Applications In Life” Fondation to support and develop accessible and understandable financial education by improving financial culture and forward-thinking mentality of the civil society.
Traders can benefit from large jumps in asset prices in volatile markets, if they can be turned into opportunities. Gaps are areas of the chart where the price of a share (or other financial instrument) moves sharply up or down, with little or no trading between them. As a result, the asset chart shows a difference in the normal pricing model. The enterprising trader can interpret and use these gaps for profit.
The gap is a blank space in the price chart between the two adjacent candlesticks.
Gaps occur when the next candlestick is opened at a distance from the closing price of the previous candlestick. This can happen if the market view of the price changes quickly and there is a sudden influx of buy / sell orders. At some point, the price that was at the closing of the candlestick is not more interesting for traders and the new price of the next candlestick better represents the value of an asset (currency pair).
In Japanese technical analysis, gaps are called “windows.”
Gap Basics
Gaps occur due to basic fundamental or technical factors. For example, if a company’s profit is much higher than expected, the company’s inventory may collapse the next day. This means that the stock price opened higher than it closed the day before, thus leaving a gap. In the foreign exchange market, it is not uncommon for the report to generate so much noise that it expands the offer and the demand spreads to a point where a significant gap can be seen. Similarly, stocks breaking a new high in the current session may open higher in the next session, thus coming out for technical reasons.
Gaps can be classified into four groups:
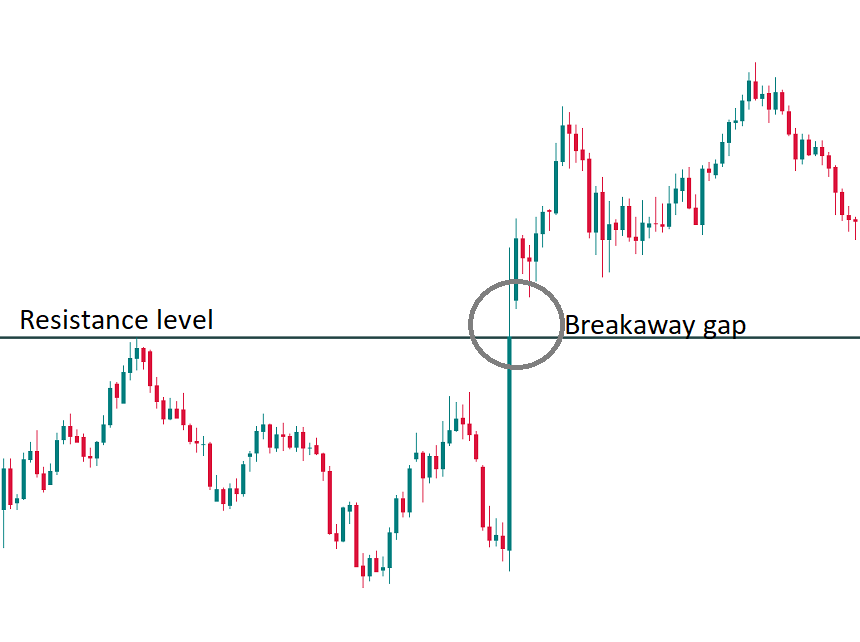
- Breakaway gaps occur at the end of the price model and signal the beginning of a new trend..
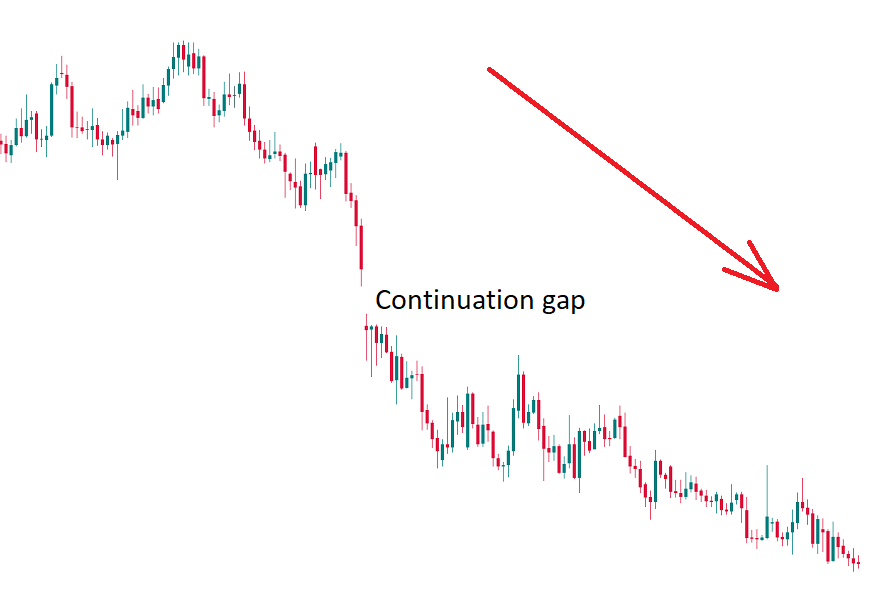
- Continuation gaps, also known as gaps, appear in the middle of the pricing model and signal an influx of buyers or sellers who share a common belief in the future direction of the major shareholder.
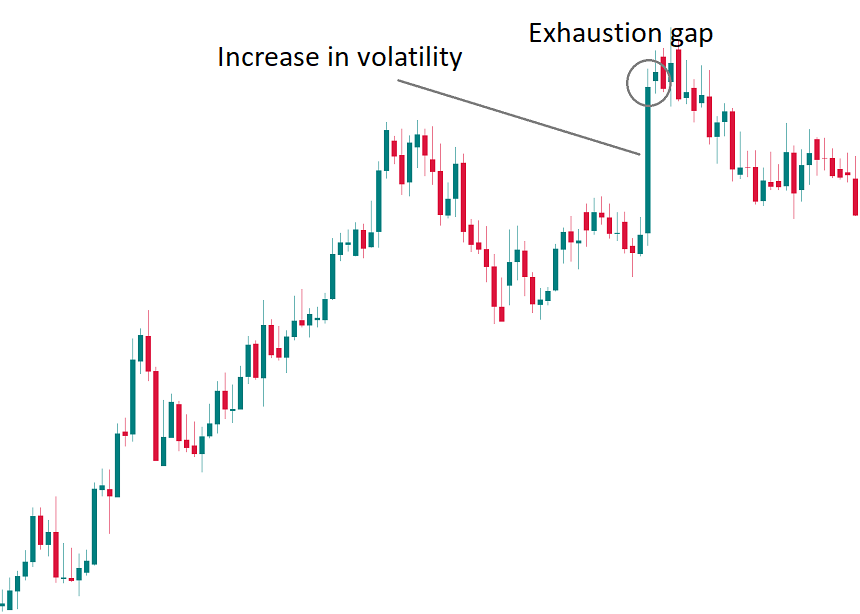
- Exhaustion gaps appear near the end of the price model and signal a recent attempt to reach new highs or lows.
- Common gaps cannot be placed in a price model – they simply represent an area in which the price has fallen.
Here are the main types of gaps:
- Breakaway gaps
Breakaway gaps appear at the end of the price model and signal the beginning of a new trend. Such gaps appear when the price tests the level of the chart – support, resistance, trend line, trend channel, etc. The price suddenly falls through the tested level and then a new trend in the direction of a breakthrough begins. It is easy to notice the gaps in the chart. Their other advantage is that by noticing such a difference, the trader can join a new trend at the earliest stage.
- Continuation gaps
Continuation gaps occur in the middle of the price model and signal an influx of buyers or sellers who believe that the price will continue to go in the same direction. In other words, if you see an uptrend during an uptrend, then you have a price difference in the continuation of the price chart. If a trend is bearish and a bearish abyss is formed, this is the bearish abyss of the sequel.
- Exhaustion gaps
Exhaustion gaps occur near the end of the price model and signal a final attempt to reach new highs or lows. During this time, the last part of the market players join the trend and then there will be no one to support it. As a result, the difference in depletion was followed by a reversal in price action. It is possible to take a gap for exhaustion for a sequel. To make the right distinction between these two types of gaps, look at the size of the candlesticks: if a currency pair is very unstable, the candlesticks on the chart are large and the price makes a few pulling movements, this may be a difference in exhaustion.
In addition to the types of gaps mentioned above, it is also possible to see the usual gaps. By this term we mean gaps that cannot be placed in a price model and simply represent an area in which the price has fallen.
Weekend gaps
Certain types of omissions occur after the weekend. As you know, the Forex market is not very active on Saturdays and Sundays, so the main currency trading ends on Friday and starts on Sunday night with the start of the Asia-Pacific trading session. Still, important events can happen at a time when the market is stationary. News can include a wide range of things, from political announcements and interviews to natural disasters. As a result, a large number of trade orders are accumulated before the market opens. These orders are not executed with counter orders. As there is no supply / demand, market participants should open positions for prices that are higher / lower than the prices observed on Friday night. You can easily notice weekly gaps in the M1-H4 terms. Sometimes, when there is really some big news over the weekend, the difference in opening can be very big.
To Fill or Not to Fill
When someone says that a gap has been filled, it means that the price has returned to the original level before the gap. These fillings are quite common and occur due to the following:
- Irrational exuberance: The initial jump may have been overly optimistic or pessimistic, calling for correction.
- Technical resistance: When the price moves sharply up or down, it leaves no support or resistance.
- Price Pattern: Price models are used to classify gaps and can tell you whether a gap will be filled or not. Continuation and break gaps are significantly less likely as they are used to confirm the direction of the current trend, while exhaustion gaps are usually most likely to be filled as they signal the end of the price trend.
When the gaps are filled within the same trading day on which they occurred, this is called fading. For example, suppose a company announces big earnings per share for that quarter and it grows outdoors (meaning it opened significantly higher than its previous close). Now let’s say that people realize that the cash flow statement shows some weaknesses, as the day progresses, so they start selling. Eventually, the price reaches the end of yesterday and the gap is filled. Many day traders use this strategy during the profit season or at other times when irrational exuberance is highest.
How to Play the Gaps
With several strategies being more popular than others, there are many ways to take advantage of these gaps. Some traders will buy when basic or technical factors favor the next trading day. For example, they will buy shares hours later when a positive profit statement is published, hoping for a pass on the next trading day. Hoping for good filling and a continuing trend, traders can also buy or sell in highly liquid or illiquid positions at the beginning of the price movement. For example, they can buy a currency when it changes very quickly with low liquidity and no significant resistance.
Some traders will reduce gaps in the opposite direction once a high or low point is identified (often through other forms of technical analysis). For example, if the stock is missed on a speculative report, experienced traders can reduce the difference by cutting stocks. Finally, traders can buy when the price level reaches the previous support after the gap is filled. An example of this strategy is given below.
Here are the basic things to keep in mind when trading gaps:
- Once an action begins to fill the gap, it will rarely stop, as there is often no immediate support or resistance.
- Exhaustion gaps and continuation gaps predict the price to move in two different directions – make sure you classify the difference you will play correctly.
- Retail investors are those who usually show irrational exuberance; however, institutional investors can play together to help their portfolios, so be careful when using this indicator and wait for the price to start breaking through before taking a position.
- Remember to monitor the volume. Large volume should be present in the breakaway gaps, while low volume should appear in the exhaustion gaps.
Gap Trading Example
To link these ideas, let’s look at a basic gap trading system developed for the foreign exchange market. This system uses gaps to predict retracements to a previous price. Here are the rules:
- Trading should always be in the general direction of the price (check the hourly charts).
- The currency must vary significantly above or below a key resistance level on 30-minute charts.
- The price must return to the initial level of resistance. This will mean that the gap has been filled and the price has returned to the previous resistance, the reverse support.
- There must be a candle, signifying an extension of the price in the direction of the abyss. This will help ensure that the maintenance remains intact.
Since the foreign exchange market is a round-the-clock market (open 24 hours a day from 5:00 PM EST on Sunday to 4:00 PM EST Friday), 1 gaps in the forex market appear on the chart as big candles. These big candles often happen due to the publication of a report causing a sharp movement in prices with little or no liquidity. In the foreign exchange market, the only visible gaps in the chart occur when the market opens after the weekend.
Let’s look at the following example of this system in action:
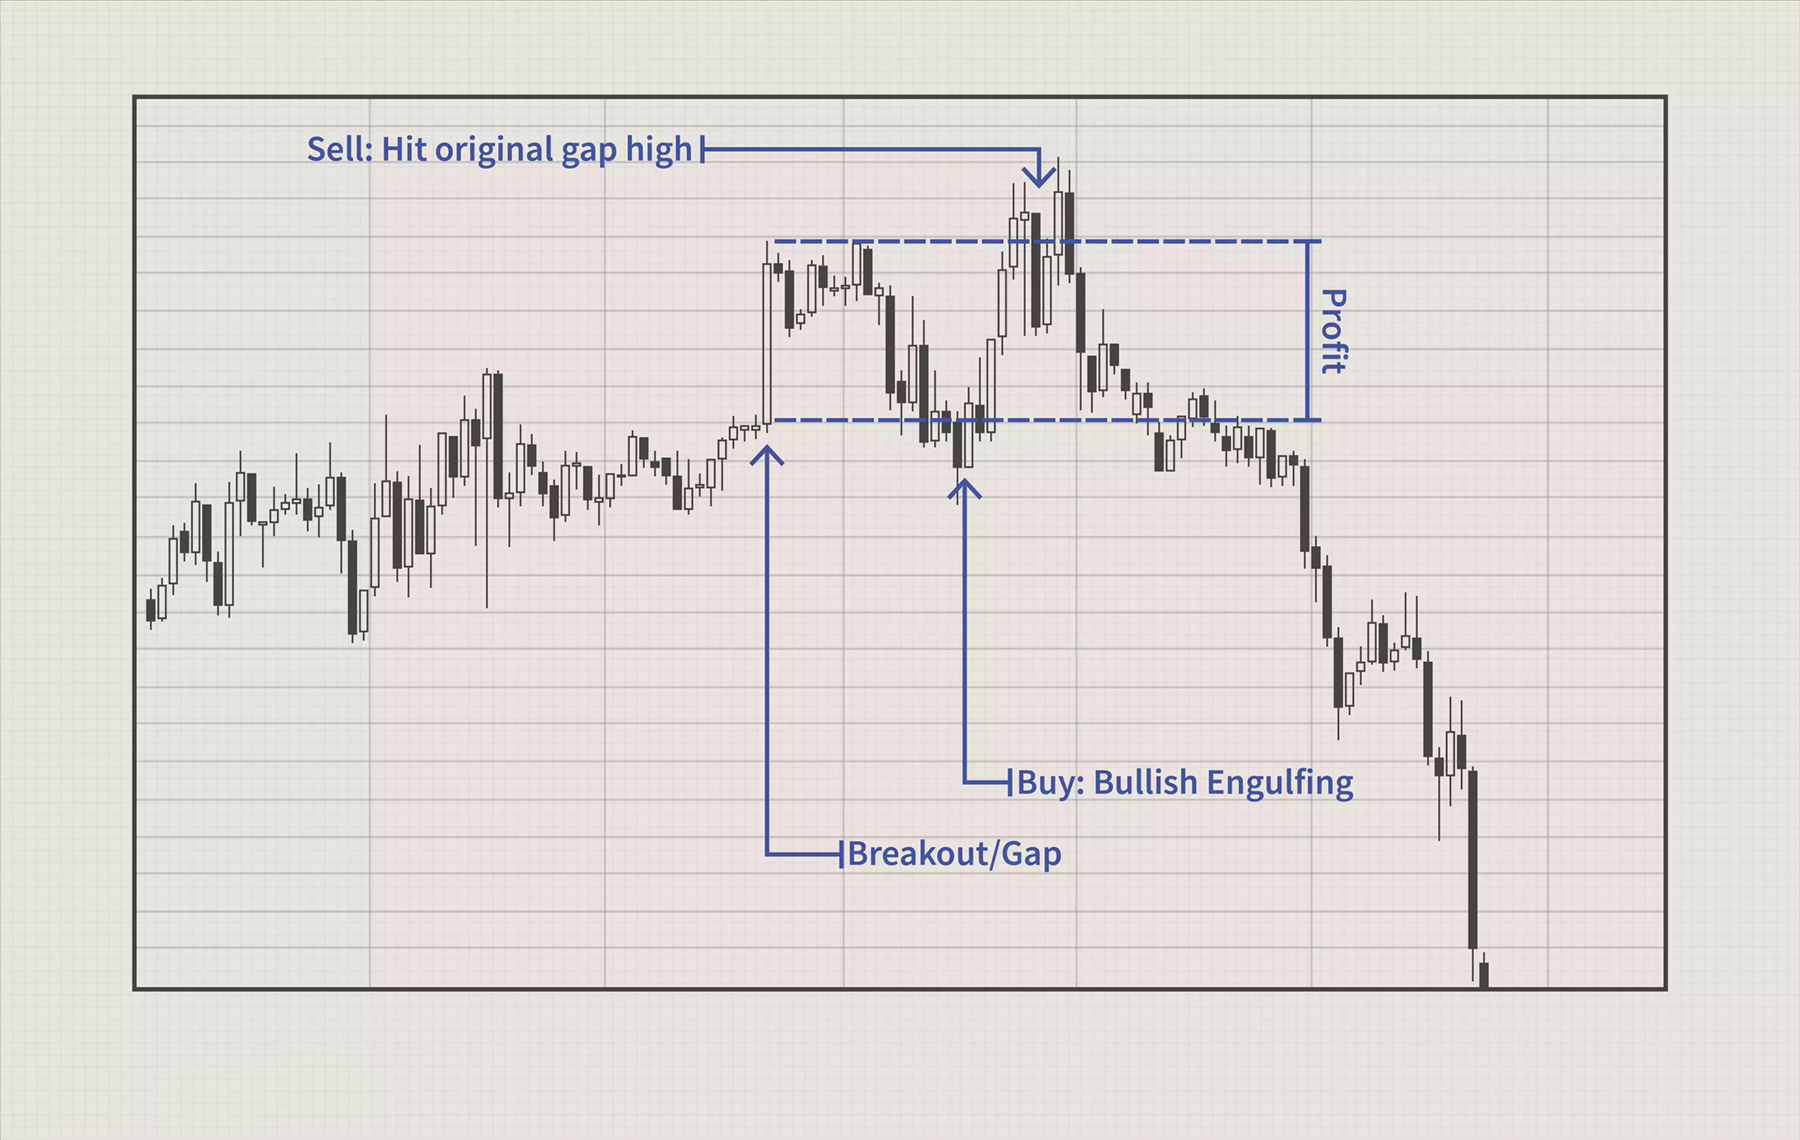
The large candlestick identified by the left arrow on this GBP / USD chart is an example of a gap found in the foreign exchange market. This does not seem like a regular difference, but the lack of liquidity between prices makes it so. Take a look on how these levels act as strong levels of support and resistance.
In the chart above we can see that the price has gapped some consolidation resistance, is tracked and fills the gap and finally continues up again before returning down. We can see that there is little support below the difference to pre-maintenance (where we buy). The trader can also shorten the currency on the way down so far if he has been able to identify a top.
The Bottom Line
Those who correctly identify its type and study the main factors behind the gap, can often trade with a high probability of success. However, there is always a chance that trade will break down. You can avoid this first by monitoring the electronic communication network in real time (ECN) and the volume. This will give you an idea of where the various open trades are. If you notice high-volume resistance that prevents a gap from being filled, double-check the premise of your trade and consider not trading it if you are not entirely sure it is correct.
Second, make sure the rally is over. The market will not necessarily immediately correct the Irrational exuberance. Sometimes stocks can rise for years at extremely high ratings and trade high on rumors without adjustment. Remember to wait for the reduction and negative volume before taking a position. Finally, always make sure you use a stop loss when trading. It is best to place the stop loss point below key maintenance levels or at a certain percentage, such as -8%.
Disclaimer: The publications on this platform aim to provide useful information on financial topics. But they are NOT financial consultation or advice. Therefore they should not be used as a recommendation for making an investment decision on any type of financial products and services. We use in-depth research in the field but do not guarantee the completeness of the published materials. Always consult a specialist in your particular situation. "Applications In Life" Foundation is not responsible for any adverse consequences resulting from actions taken based on the information provided on the platform.