This publication aims to help fulfil the mission of “Applications In Life” Fondation to support and develop accessible and understandable financial education by improving financial culture and forward-thinking mentality of the civil society.
Currencies
The exchange rate represents the numerical ratio of one currency to another. The term is widely used in the foreign exchange market “currency pairs”. Depending on the duration of the foreign exchange transactions, there are two types of exchange rates – spot rate and forward rate.
The world’s currencies are traded on the Forex market. But let’s start with the very basics – What is a currency?
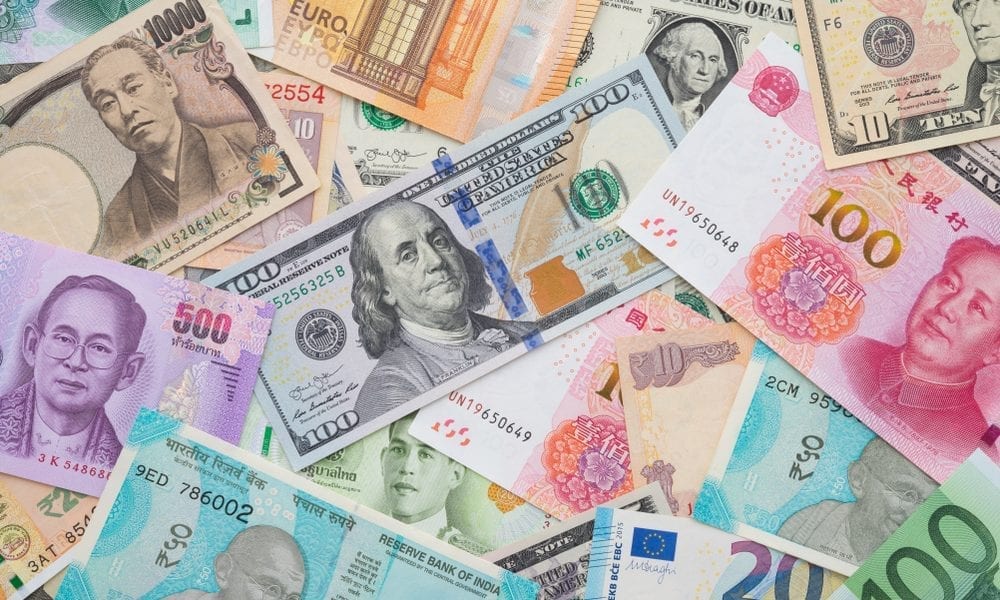
Currency is the national currency of a country or group of countries. For Western Europe it is the euro, for the USA it is the dollar, for Japan – the yen, etc.
The word currency is derived from the Latin word “currens”, which means “running” or “in circulation.” A currency is money used as a medium of circulation, such as banknotes and coins. Some sources refer to currencies as a system of money used among people in a nation.
The United Nations currently recognise 180 currencies that are used in 195 countries across the world. Some examples of currencies are the US dollar, the Euro, the British pound and the Japanese yen, which all act as a store of value and which are traded on the global foreign exchange market (Forex).
Just like other assets, the forces of supply and demand determine the value of a currency relative to another currency. Increased supply of a currency sinks its value, while increased demand pushes its value up.
Currency pairs
Even though currencies are traded on the Forex market, we’re not able to buy or sell single currencies. Each time we place a trade in the market, we have to trade on currency pairs. Currency pairs consist of two currencies – the first one is the base currency and the second one the counter-currency.
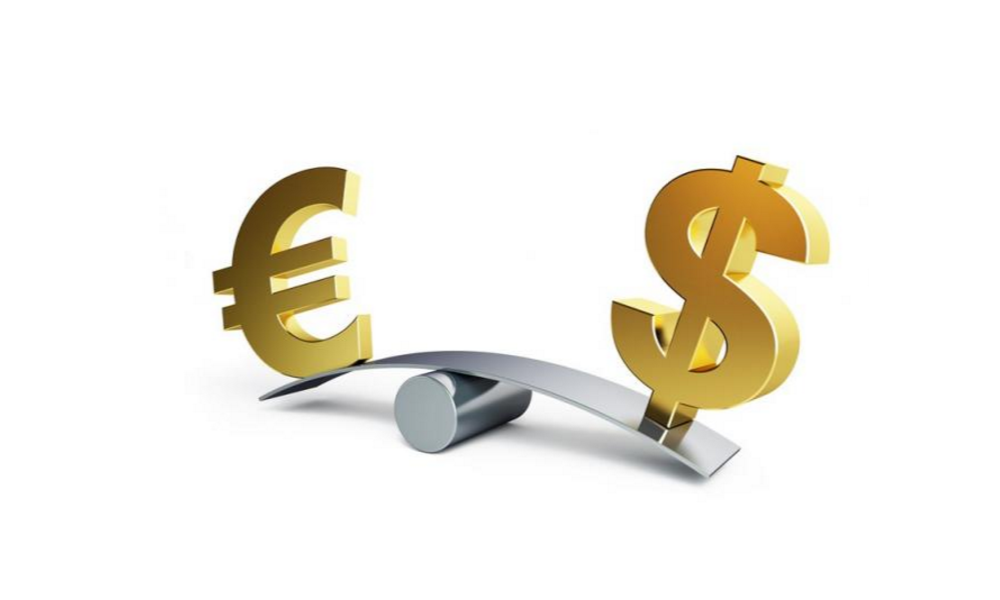
An example of a currency pair is the EUR/USD pair. When we buy the EUR/USD pair, we’re actually buying the euro and selling the US dollar. Similarly, when we sell the EUR/USD pair, we’re actually selling the euro and buying the US dollar.
Major pairs
In general, currency pairs can be grouped into major pairs, cross pair, and exotic pairs. Major pairs are currency pairs that include the US dollar as either the base currency or counter-currency and one of the other seven major currencies (EUR, CAD, GBP, CHF, JPY, AUD, NZD.)
If you’re just beginning with trading, you should focus on the major pairs since they usually offer very low transaction costs and enough liquidity to avoid high slippage. Examples of major pairs are EUR/USD, GBP/USD and USD/CHF.
Cross pairs and exotics
Cross pairs, on the other hand, include any two major currencies except the US dollar. Unlike major pairs, cross pairs have higher transaction costs and, at times of lower liquidity, traders can face slippage. Cross pairs are also usually more volatile than major pairs. Examples of cross pairs include EUR/GBP, EUR/CHF and AUD/NZD.
Finally, exotic pairs include exotic currencies which are not in the Top 10 of the most traded currencies, such as the Mexican peso, Turkish lira or Czech koruna. Since those currencies can be extremely volatile, they should be left to be traded by the pros.
Exchange rate
The exchange rate of a currency pair is what all traders follow. The exchange rate is often called simply the price, because it shows the price of the base currency expressed in terms of currency. For example, if the exchange rate of EUR/USD is 1.15, this means that one euro costs $1.15, or it takes $1.15 to buy one euro.
A rise in the exchange rate of a currency pair shows that the base currency is appreciating against the counter-currency or that the counter-currency is depreciating against the base currency. Similarly, a fall in the exchange rate shows that the base currency is depreciating against the counter-currency or that the counter-currency is appreciating against the base currency.
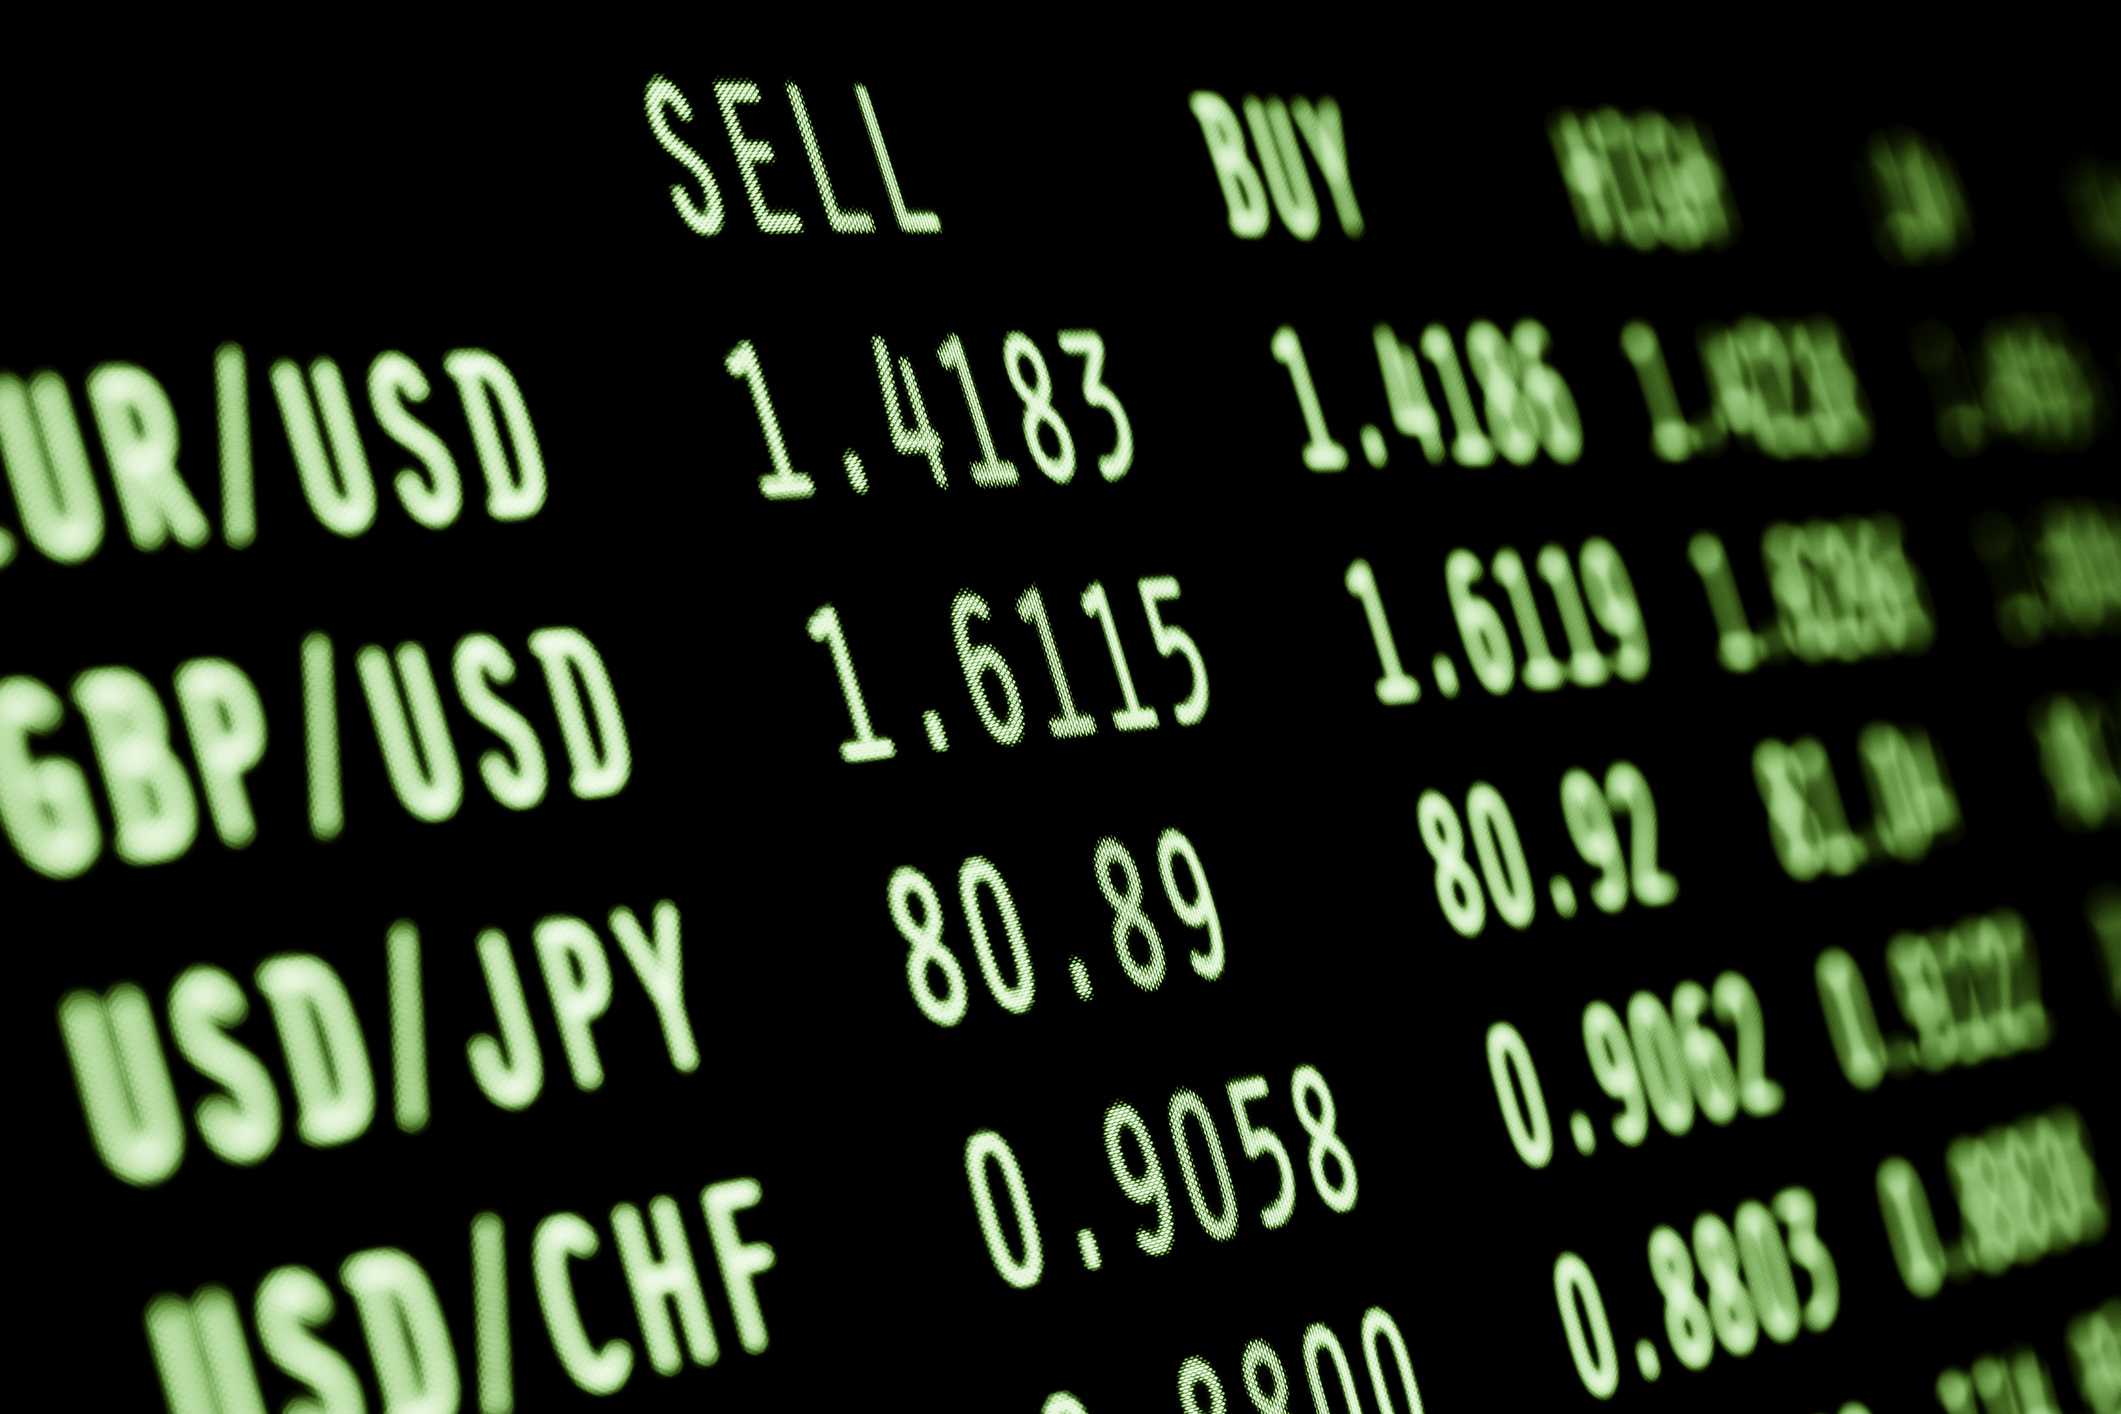
Bid/ask price
At any given moment, each currency pair has two exchange rates or prices – the bid price and the ask price. What’s the difference between those two? The bid price is the price at which buyers are willing to buy, while the ask price is the price at which sellers are willing to sell.
Given its nature, the bid price is always lower than the ask price. Once those two prices meet, either when sellers lower their ask price to meet a buyer’s bid price or when buyers increase their rate they’re willing to pay for a currency and meet a seller’s ask price, a transaction occurs.
In the end, buyers buy at the ask price, and sellers sell at the bid price. This means that each price plotted on your chart represents the market equilibrium at that point of time – the price at which the majority of market participants are willing to transact.
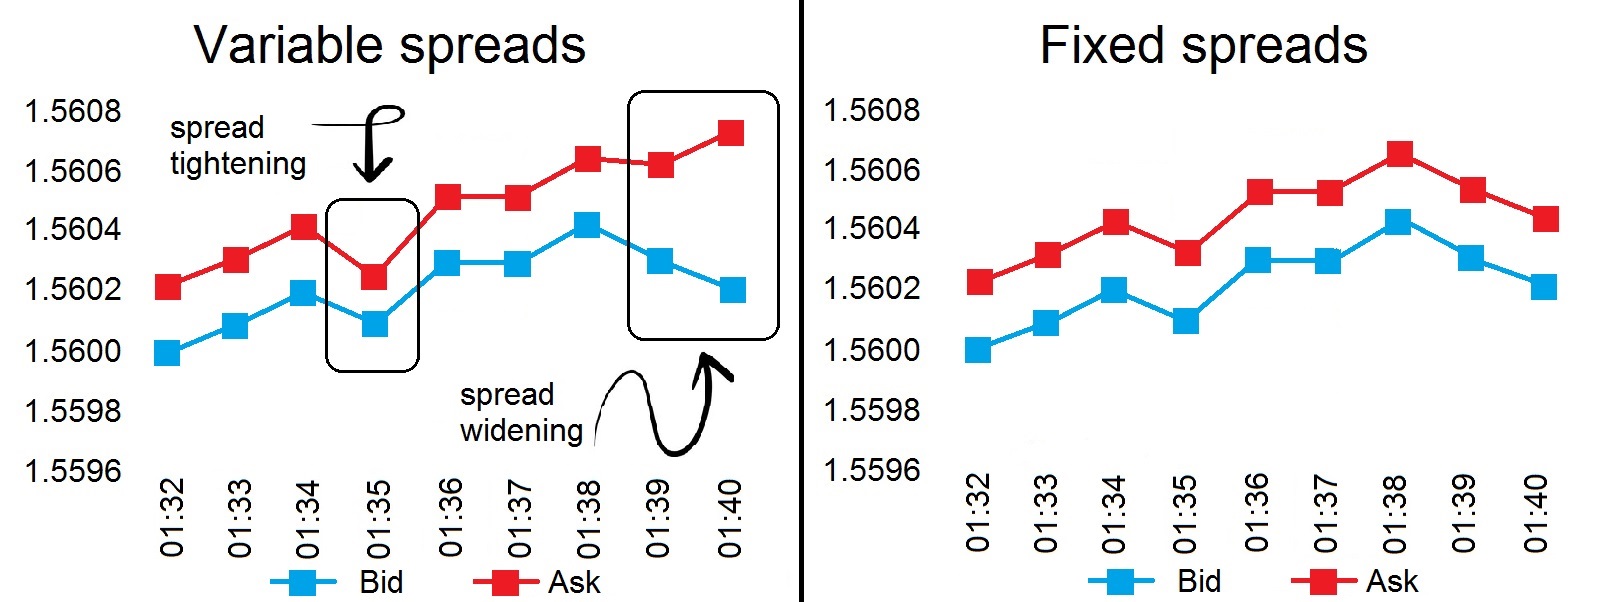
Spread
Each time you enter into a trade, you have the pay transaction costs for that trade. While most brokers do not charge commissions and trade fees these days, bid / ask spread remains the primary price for Forex traders. When bulls buy at the ask price (the price at which sellers are willing to sell), their position is immediately in a loss that equals the bid/ask spread.
If you’re a day trader or scalper, you need to pay attention to the bid/ask spread since it can eat a large portion of your profits at the end of the day. Swing traders and position traders who have a longer-term approach to trading are less affected by the spread as they open a smaller number of positions and have relatively higher profit targets.
Pip
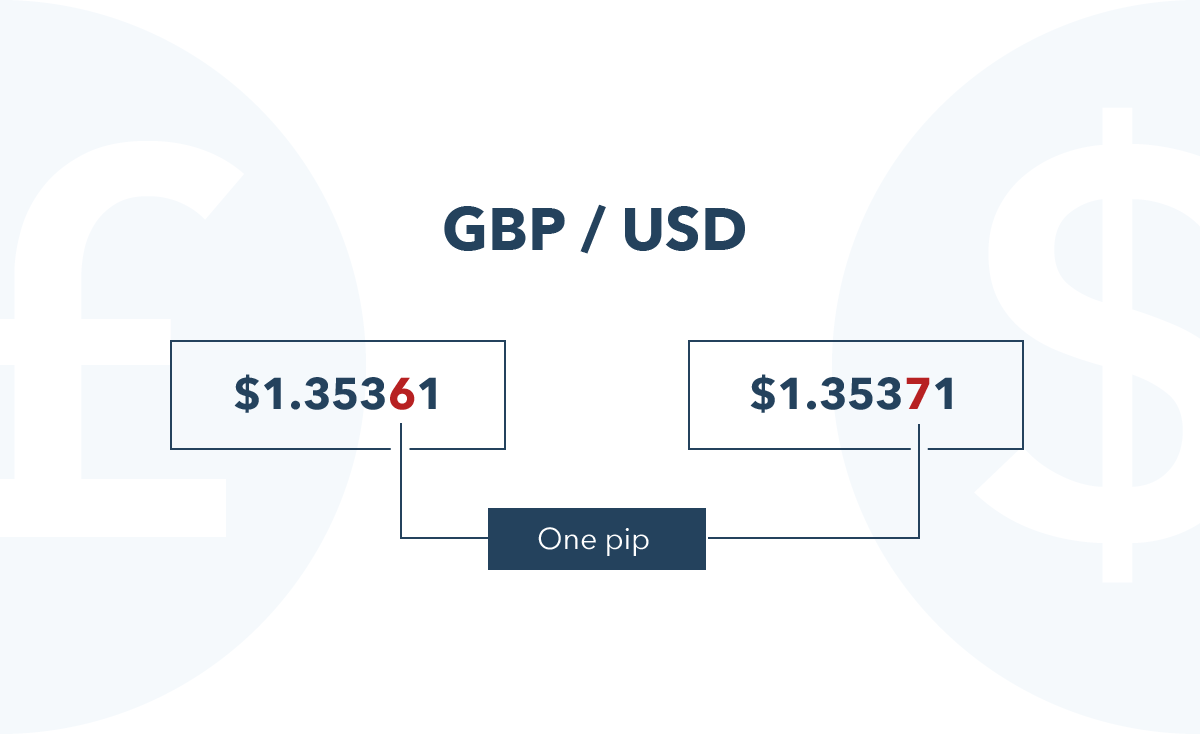
When Forex traders talk about profits or losses, they usually use the term “pips”. A pip is short from Percentage in Point and represents the smallest increment that an exchange rate can move up or down. Usually, one pip equals to the fourth decimal of most currency pairs.
For example, if GBP / USD is currently trading at 1.3536 and rising to 1.3537, this increase would be equal to a change of 1 pip.
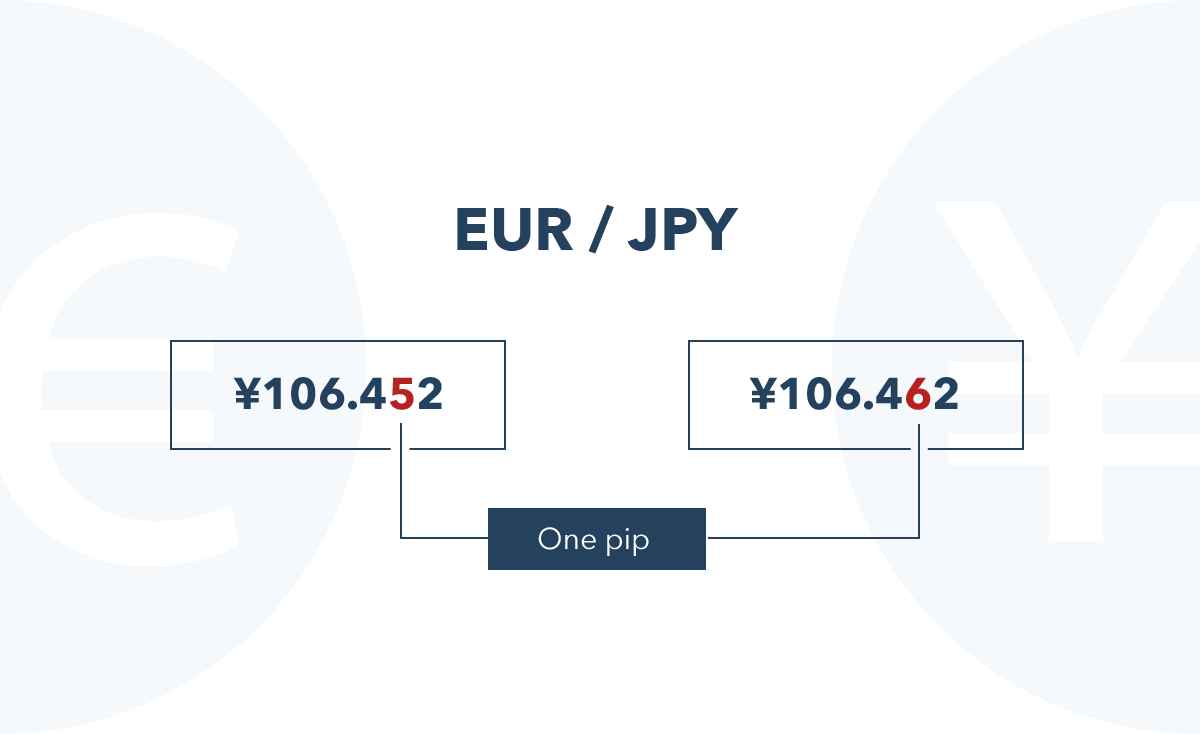
However, some currency pairs have their pips located at the second decimal place, mostly yen-pairs. If EUR / JPY is currently trading at 106.45 and raising to 106.46 , this increase will be a change of 1 pip.
Pipette
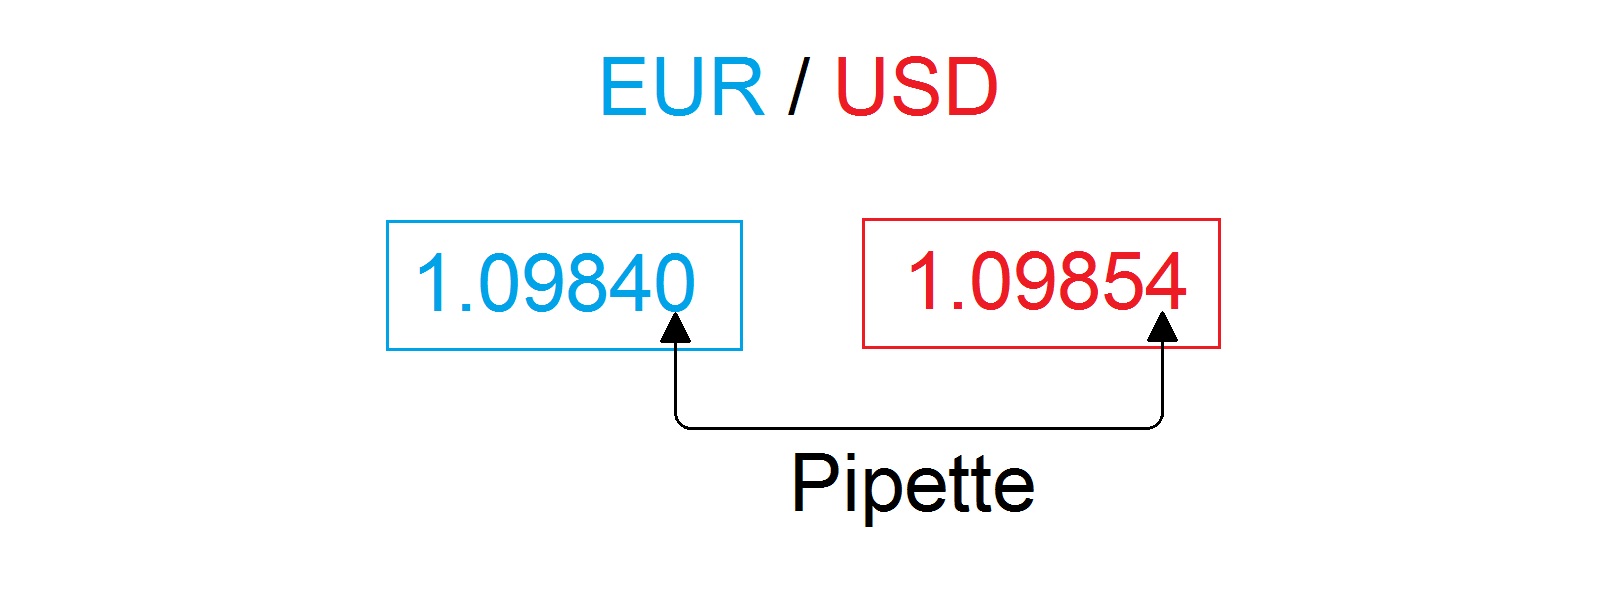
A pip represents the fourth decimal place of most currency pairs, but there is an even smaller increment that prices can change. It’s called a pipette and equals 1/10 of a pip, i.e. 10 pipettes are one pip. A pipette is located at the fifth decimal place of most pairs (in yen-pairs, they’re at the third decimal place.)
Most traders don’t follow movements in pipettes, even though some brokers use them in their trading platform. Today, pipettes are mostly used to measure the bid/ask spread, where a tenth of a pip is needed. For example, the spread in EUR/USD might be 1.4 pips, or one pip and four pipettes.
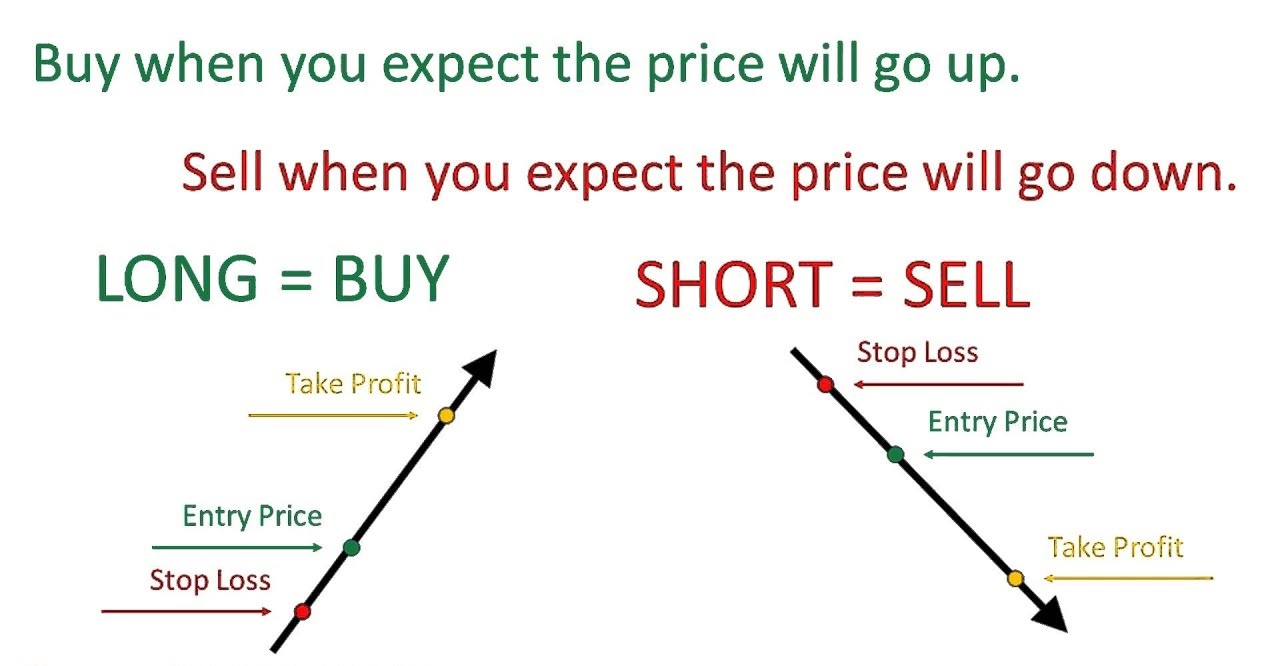
Going long/short
You’ve probably heard about going long or short in a currency pair. Going long just means buying, and going short means selling. In equity markets, most traders are long in anticipation of rising prices. However, in derivative markets, such as options and futures, there is always an equal number of longs and shorts in the market, because each new contract that is bought needs a corresponding seller who needs to go short, and vice-versa.
Because Forex is primarily traded in CFDs, traders can bet on both rising and falling prices. When buying, they’re going “long”, and when short-selling, they’re going “short”.
Support
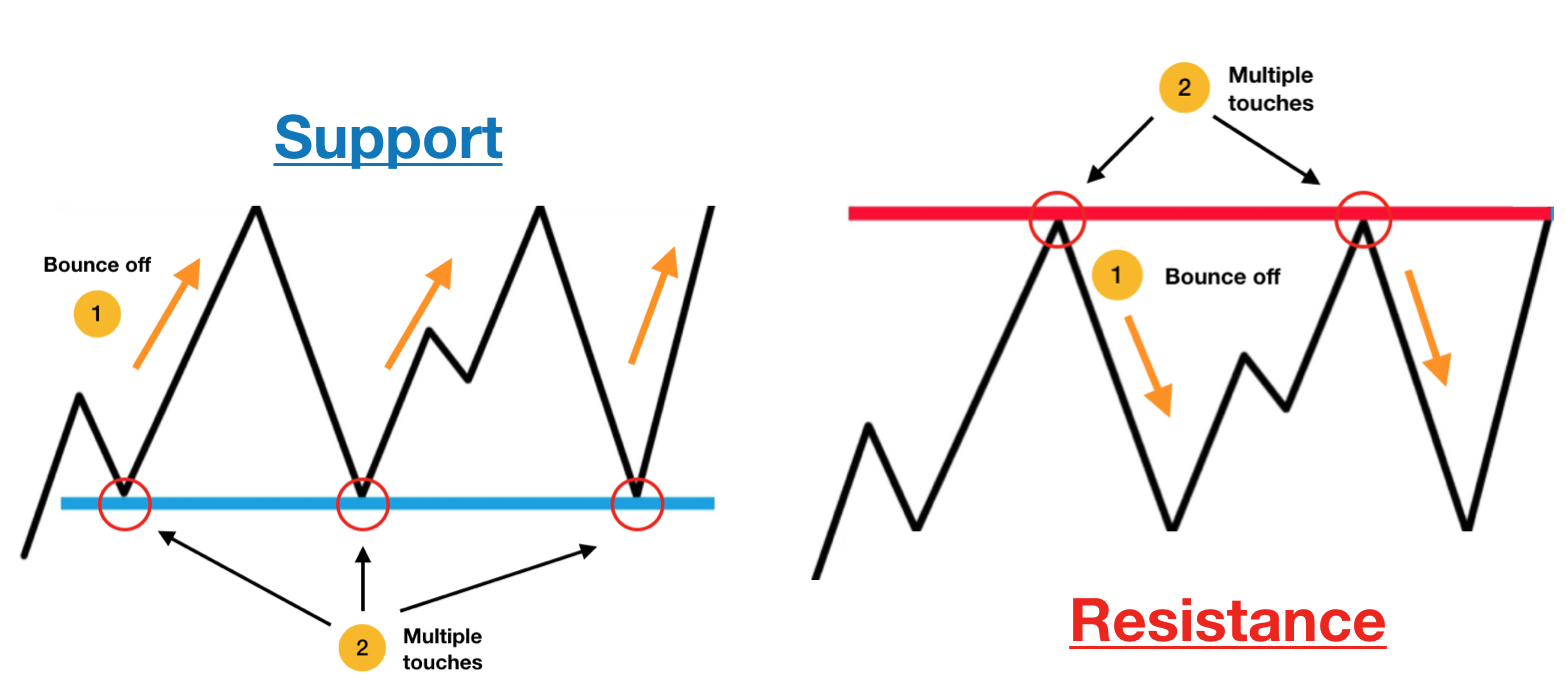
Support and resistance are one of the most important concepts in technical analysis. Technical traders analyse only price-moves as they believe that the price reflects are available fundamental information, and support and resistance trading plays an important role in that analysis.
Markets are made by a multitude of people who speculate, hedge, trade, invest or bet on the markets. Since people have memory, they remember certain price-levels where the price had difficulties to break below in the past.
They place their buy orders around those levels, as they believe that the price will again fail to break below. This is how support levels are formed. In other words, a support level is a previous low at which the price has a large chance to retrace and move up.
Resistance
Just like support levels, resistance levels are also a crucial tool in a technical trader’s toolbox. While support levels are based on previous lows, resistance levels track previous highs at which the price had difficulties to break above.
Traders remember those levels and place their sell orders around them, as they believe that those levels will again provide selling pressure and move the price down. Since fresh memory is more important than old memory, recent support and resistance levels usually have a higher importance than old support and resistance levels.
Leverage
The Forex market is open around the clock and offers traders to profit not only from rising prices but also from falling ones. However, there is another reason why a large number of traders feel attracted to the Forex market – leverage.
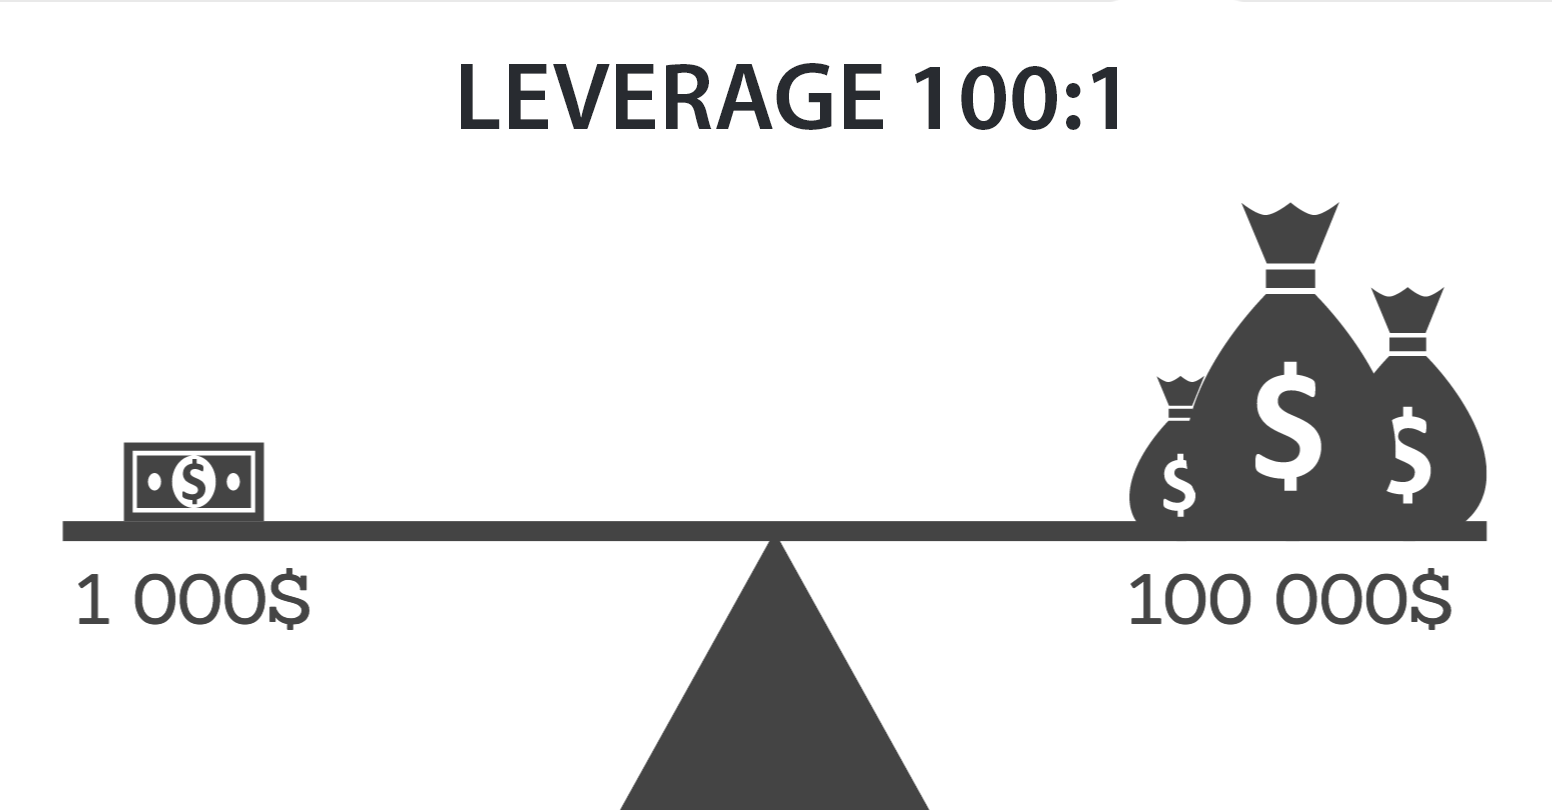
Trading on leverage allows traders to open a much larger position size than their initial trading account size would otherwise allow, and the Forex market is known for extremely high leverage ratios offered by retail brokers.
For example:
A 100:1 leverage allows a trader to open a position that is a hundred time larger than their initial deposit. If you deposit only $1,000, you’re allowed to open a position size equal to $100,000!
However, bear in mind that trading on extremely high leverage is very risky, as it boosts not only your profits, but also your losses. Beginners should consider trading lower leverage until they have enough experience and screen time. This will reduce losses and make sure that you stay in the game in the long run.
Margin
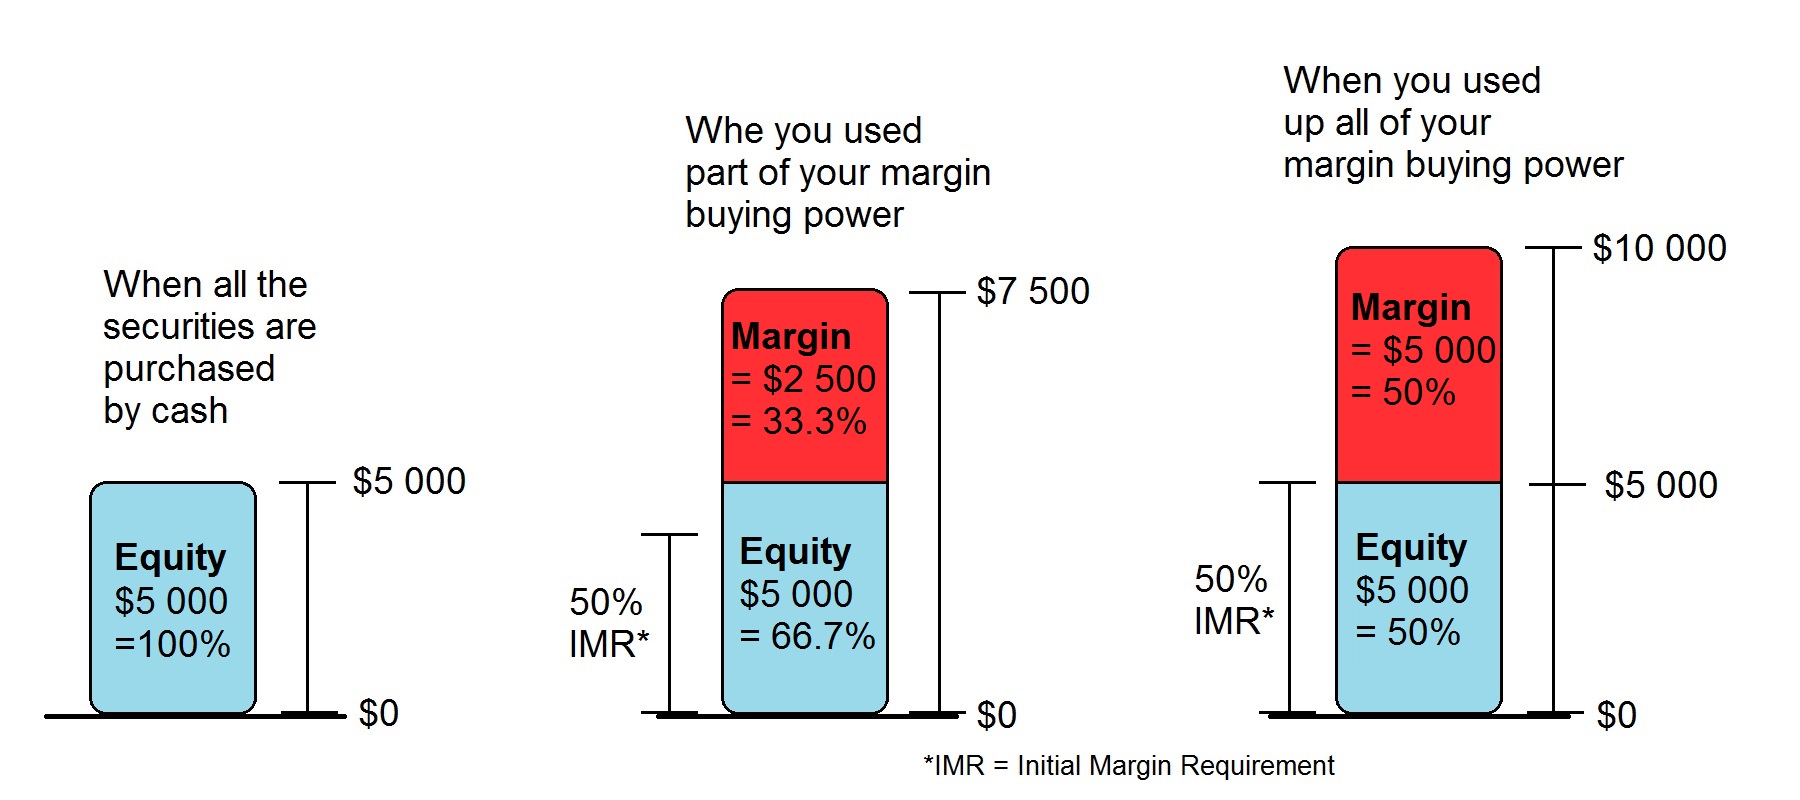
When trading on leverage, your broker will allocate a portion of your trading account size as the collateral for the leveraged trade. This collateral is called “margin” and its size depends on the leverage ratio that you’re trading on. A leverage ratio of 100:1 asks for a margin that equals 1% of your position size.
What’s important when trading on leverage is to always keep an eye on your free margin. Your free margin equals your total equity (account size + any unrealized profits/losses), minus your used margin. If your free margin drops to zero, you’ll receive a margin call and all your open trades will be closed at the current market rate.
For example:
If you open a $100.000 position size using a 100:1 leverage, your margin will equal $1,000, which is 1% of the position size. Similarly, if you open a position size of $40.000 with a leverage ratio of 100:1 and a trading account size of $1.000, your broker will allocate a margin the size of $400.
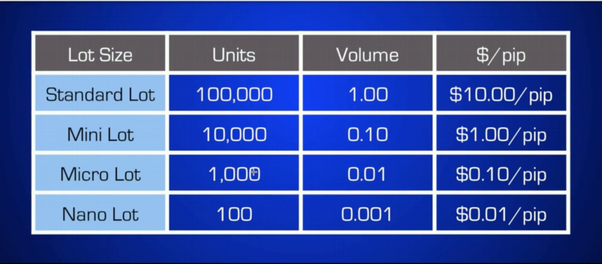
Lot size
The position size you take on the market determines the size of your profits and losses in dollar value by affecting the value of a single pip. In the Forex market, one standard lot (standard position size) equals to 100.000 units of the base currency. For example, if you take one standard lot in the EUR/USD pair, you’re actually trading 100,000 euros with a pip-value equal to $10.
Fortunately, traders with smaller account sizes can take smaller trades with mini-lots (10.000 units of the base currency) and micro-lots (1.000 units of the base currency.) Some brokers even allow you to trade on nano-lots (100 units of the base currency.) In any case, calculate your lot size in dependence of the size of your stop-loss so that you remain inside your risk-management boundaries.
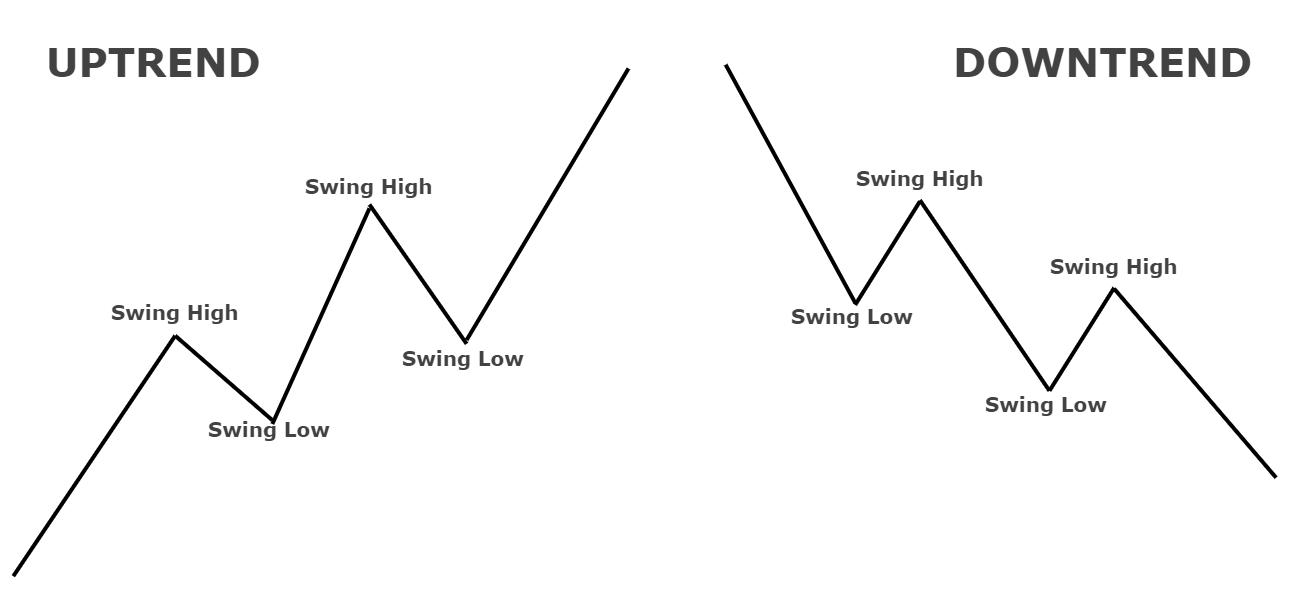
Trend
A trend is a tendency for prices to move in a certain direction for a certain period. Trends can be long term, short term, up, down and even sideways. The successfull investing in the forex market is tied to the investor’s ability to identify profitable entry and exit points.
In its most basic form, an uptrend line is outlined at the bottom of easily recognizable retaining zones (valleys).
In a down trend, the trend line is drawn at the top of easily recognizable areas of resistance (peaks).
To draw the lines of the forex trend correctly, all you have to do is find two main peaks or bottoms and connect them.
A popular trade term is “the trend is your friend”. This expression withstands the test of time because trends are critical to any trading plan. Forex trends can be seen in almost every chart analysis because of its usefulness and simplicity. It is very important to learn how to trade in an imperfect world. The trade trend is a simple way to cover up the imperfections of the strategy by identifying the strongest market trends.
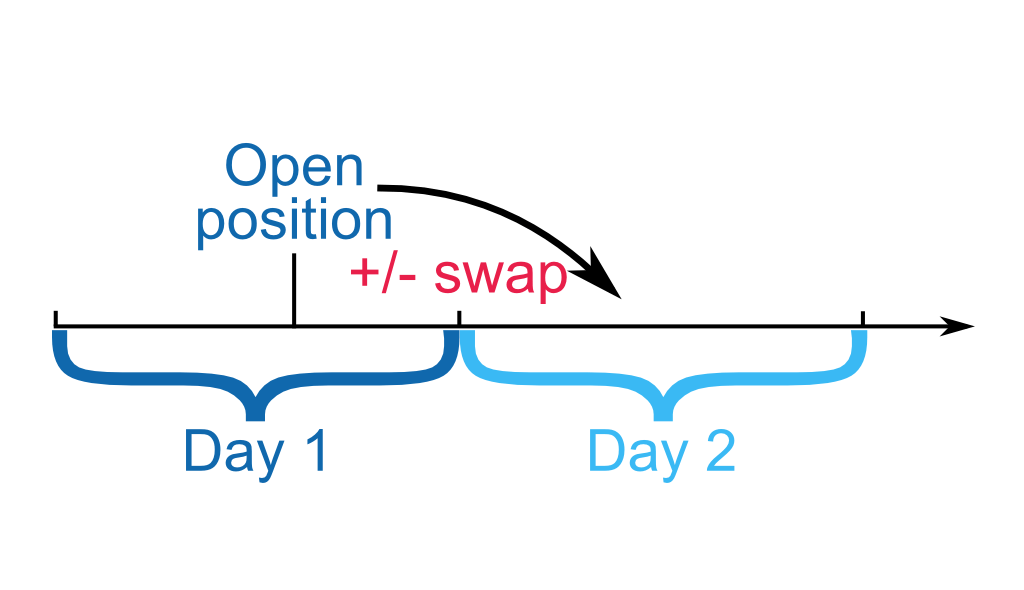
Swap
A swap is a derivative contract whereby two parties exchange cash flows or liabilities from two different financial instruments. Most swaps involve cash flows based on the notional amount of the principal, such as a loan or a bond, although the instrument can be just about anything. Usually the principal does not change hands. Each cash flow includes one swap foot. One cash flow is usually fixed, while the other is volatile and is based on a base rate, a floating exchange rate, or an index price.
The purpose of engaging in a foreign currency swap is usually to lend in foreign currency at cheaper interest rates than if they were to borrow directly in a foreign market. In 1981 the World Bank first introduced currency swaps in an attempt to obtain German marks and Swiss francs. This type of swap can be made on loans with a maturity of up to 10 years. Currency swaps are different from interest rate swaps in that they also involve major exchanges.
In a currency swap, each country continues to pay interest on the principal sums outstanding throughout the loan. When the swap is completed, the principal amounts are exchanged once more at a pre-agreed rate (which would avoid the risk of the transaction) or a spot rate.
There are two main types of currency swaps. Fixed-currency swap with a fixed currency involves the exchange of fixed interest payments in one currency for fixed interest payments in another. For fixed-rate payment swaps, fixed interest payments in one currency are exchanged for floating interest payments in another. For the latter type of swap, the principal amount of the principal loan is not replaced.
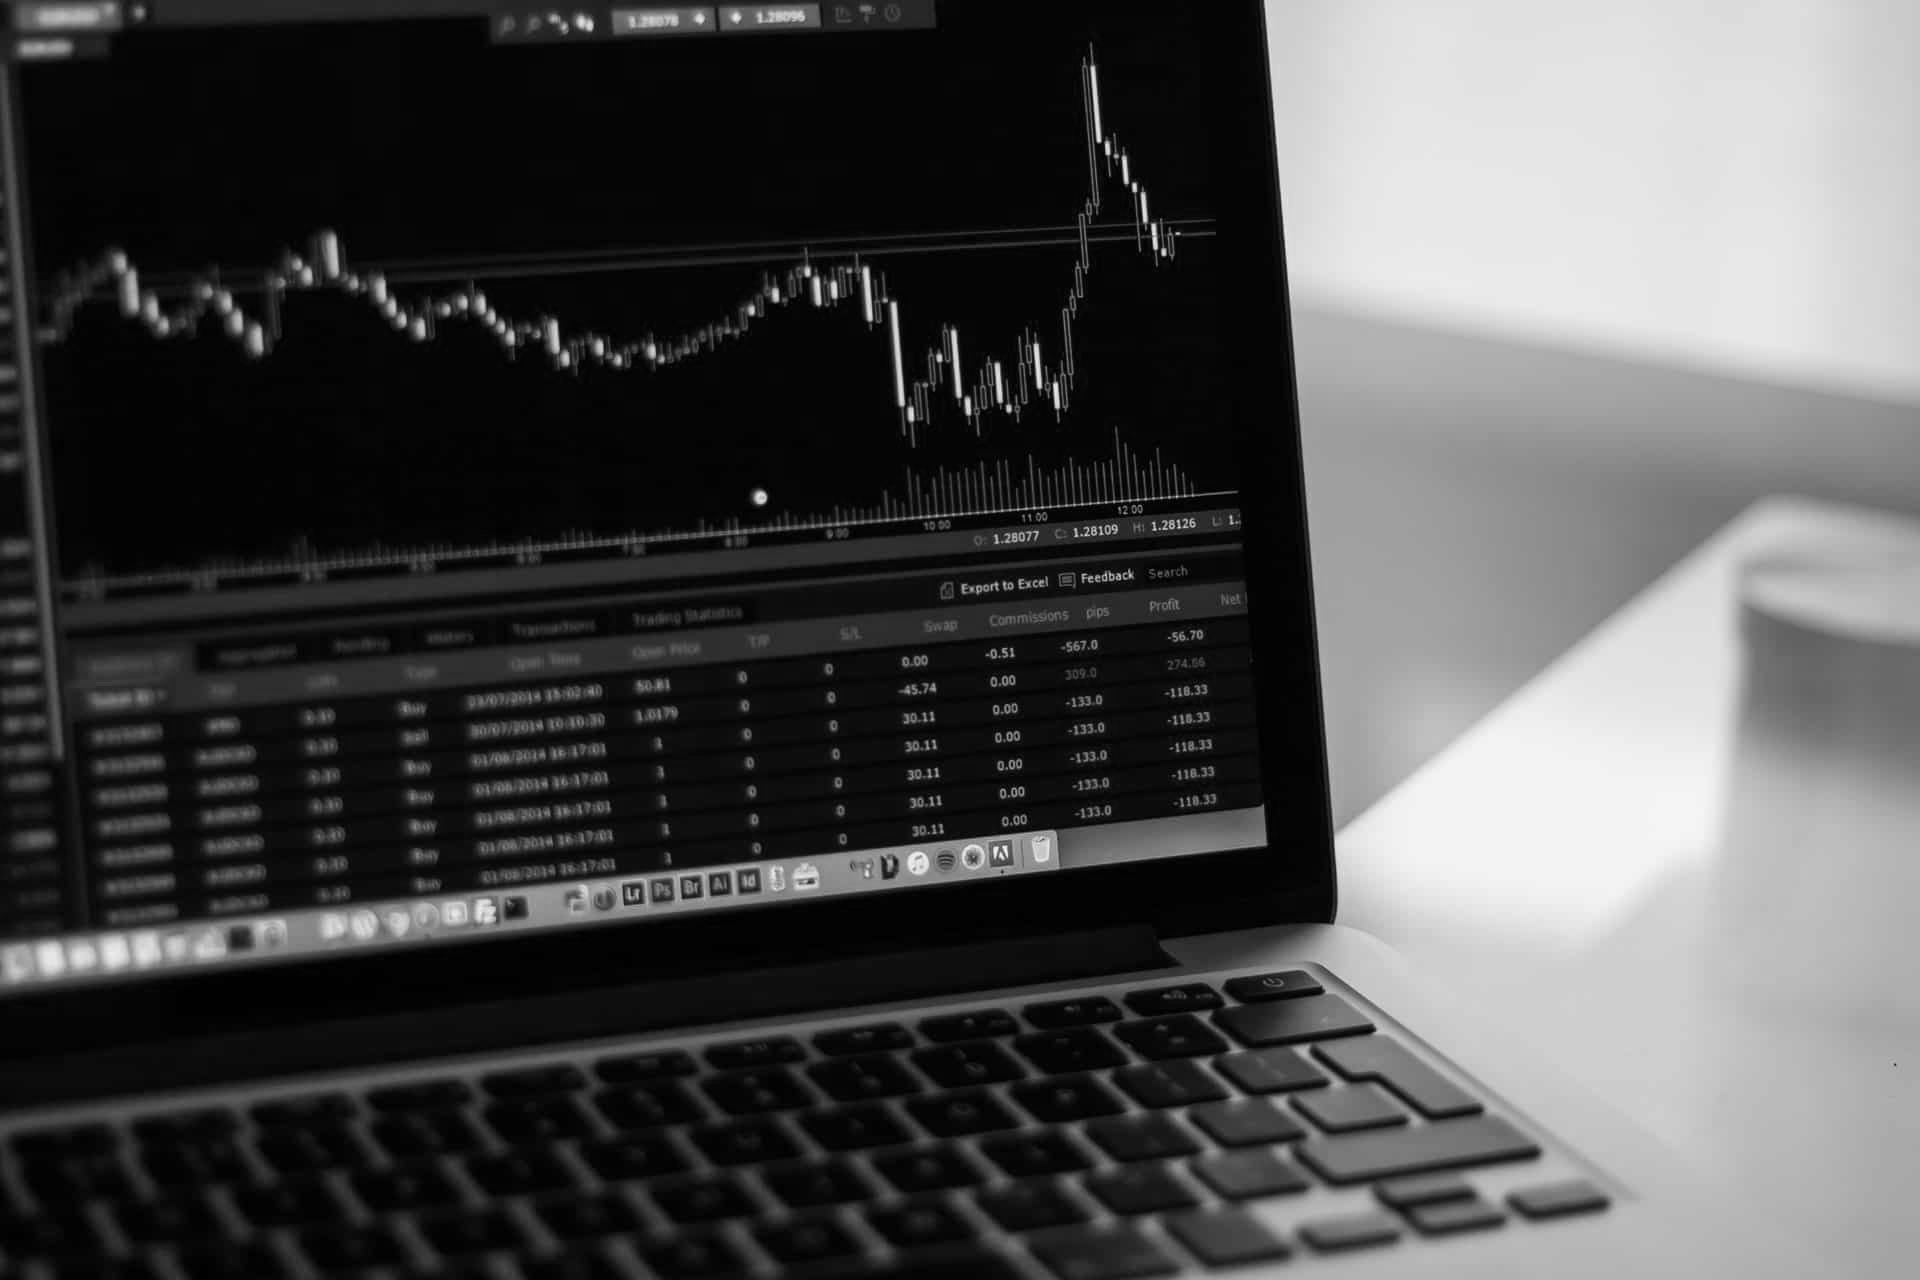
Charts
Forex charts essentially allow a trader to see the past, which, according to technical analysts, may be a predictor of future price movements. Most forex brokers will provide free forex trading software for clients who have opened and funded trading accounts. Forex charts, such as those available for other securities, provide information useful for the technical analysis of a particular currency pair (FX).
Forex charts are essential tools for forex traders who wish to incorporate technical analysis to determine where to invest their funds as they can reveal the existence of trends. Technical analysis is the review of past market prices and technical indicators to predict the future movements of an investment. These technicians believe that short-term price movements are the result of supply and demand forces in the market for a given security. Thus, for technicians, the fundamentals of the asset are less relevant than the current balance of buyers and sellers.
The most common types of forex charts are line, bar, and candlestick charts and the normal time frames that most platform’s charting software provide range from tick data to yearly data. A typical forex chart will show the time period on the x-axis and the exchange rate on the y-axis.
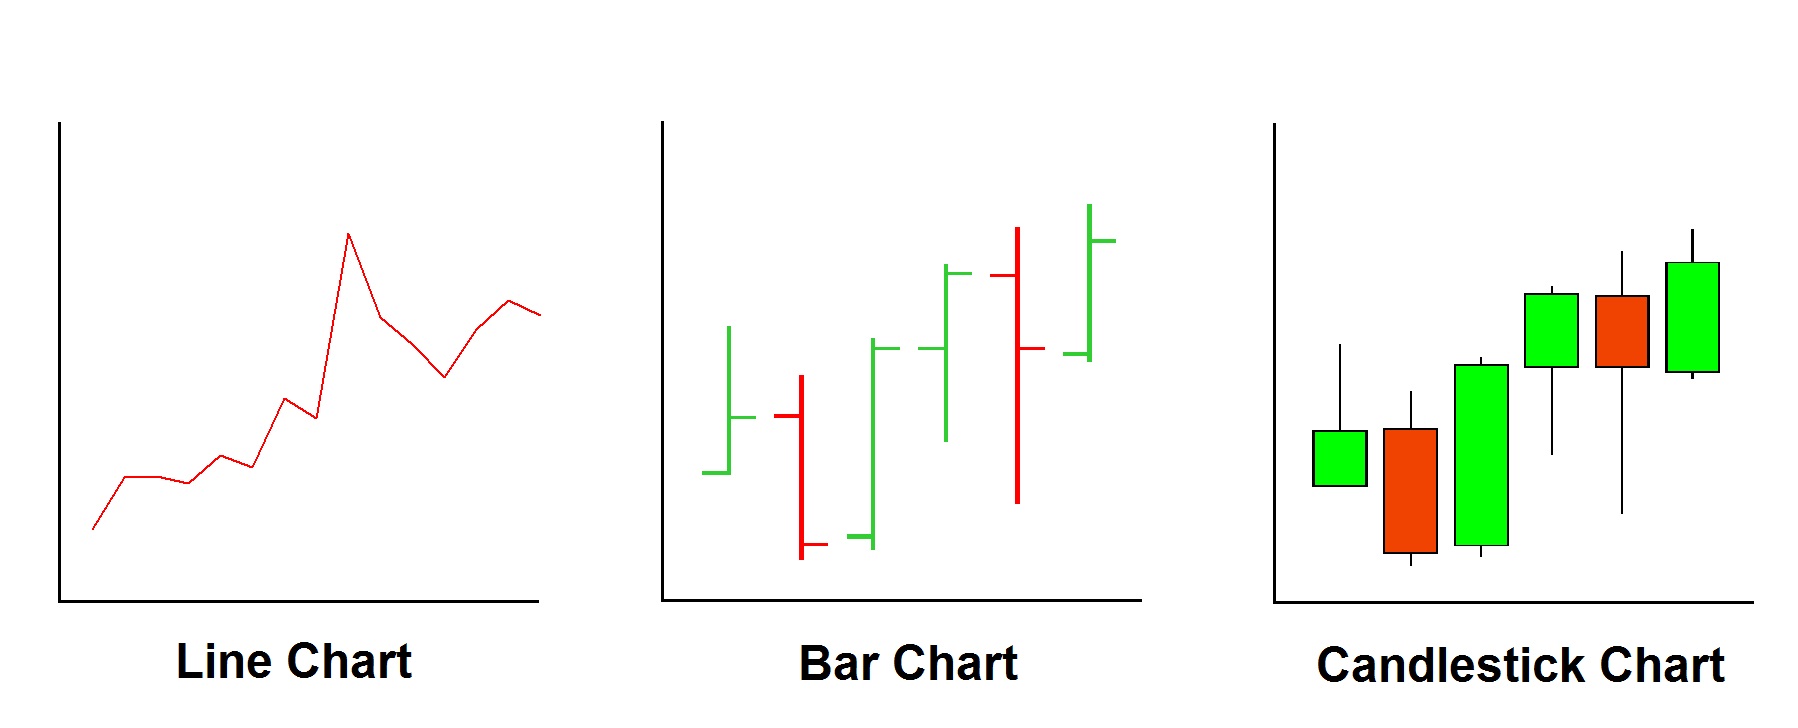
Line chart
Line graph is the first type of graph we will focus on. The way it is formed is as follows: a period of approximately one hour is chosen and the point corresponding to the price at the end of that period is plotted. The period can be different – one-hour, four-hour, daily, weekly, monthly, etc. After the points for the individual periods are set, they are connected and thus a linear graph is formed. In addition to closing prices, linear graphics can also be made at average and opening prices.
Bar chart
Bar charts are made up of figures called bars. Depending on the time period of the chart, the bar represents the change in prices for a given period. For example, if the graph is one-hour, this means that one bar will show the price movement for one hour, if it is four-hour, that is, the bar will be for a four-hour period. In the event that one bar is formed at a distance from the previous one, this distance is called gap. Usually gaps are found mainly in stocks, because there the market is not around the clock and it is possible to negotiate deals after the end of the working session, and then the opening of the market will start with a gap.
Candlestick chart
Japanese candles are historically the oldest and most used way of reflecting market movements. In essence, they look somewhat like bar graphs, but in contrast. Japanese candles use different colors to represent the trend direction. The bullish candle is green and the bearish is red. In the bullish candle, the distance from the closing price to the highest price is called the upper shadow, and the distance from the opening price to the lowest price is called the lower shadow. It is the same with a bear candle. When talking about candles, it should be mentioned that they also allow the formation of gaps.
Forex Market Trading Hours
The market is open 24 hours a day in different parts of the world from 5:00 pm. EST on Sunday until 4pm. EST on Friday. There is at least one market open at any one time and there are several hours of overlap between market closure in one region and another opening. The international scope of currency trading means that there are always traders around the world who make and qualify for a particular currency.
The ability of the foreign exchange market to trade for a period of 24 hours is due in part to different international time zones and actual transactions are made through a network of computers rather than a physical exchange that closes at some point. For example, when you hear that the US dollar closed at a certain rate, it simply means that it was the market rate closed in New York. This is because currency continues to be traded around the world long after New York closed, unlike securities.
Securities such as domestic equities, bonds and commodities are not as relevant or needed on the international scene and are therefore not required to trade outside the issuer’s standard working day. The demand for trading in these markets is not high enough to justify opening 24 hours a day due to the focus on the internal market, which means that few shares are likely to be traded at 3:00 pm in the US.
Europe consists of major financial centers such as London, Paris, Frankfurt and Zurich. All banks, institutions and dealers conduct foreign exchange trading for themselves and their customers in each of these markets.
Currency trading begins every day with the opening of the Australia area, followed by Europe and then North America. As markets in one region close, another opens or is already open and continues to trade in the foreign exchange market. These markets often overlap for several hours, providing some of the most active periods of forex trading.
For example, if a forex trader in Australia wakes up at 3am and wants to trade currency, they will not be able to do it through forex dealers located in australia but can make as many transactions as they want through european or north american dealers.
International forex markets consist of banks, trading companies, central banks, investment management companies, hedge funds, as well as trading forex brokers and investors worldwide. Because this market operates in multiple time zones, you can access it at any time except for the weekend break.
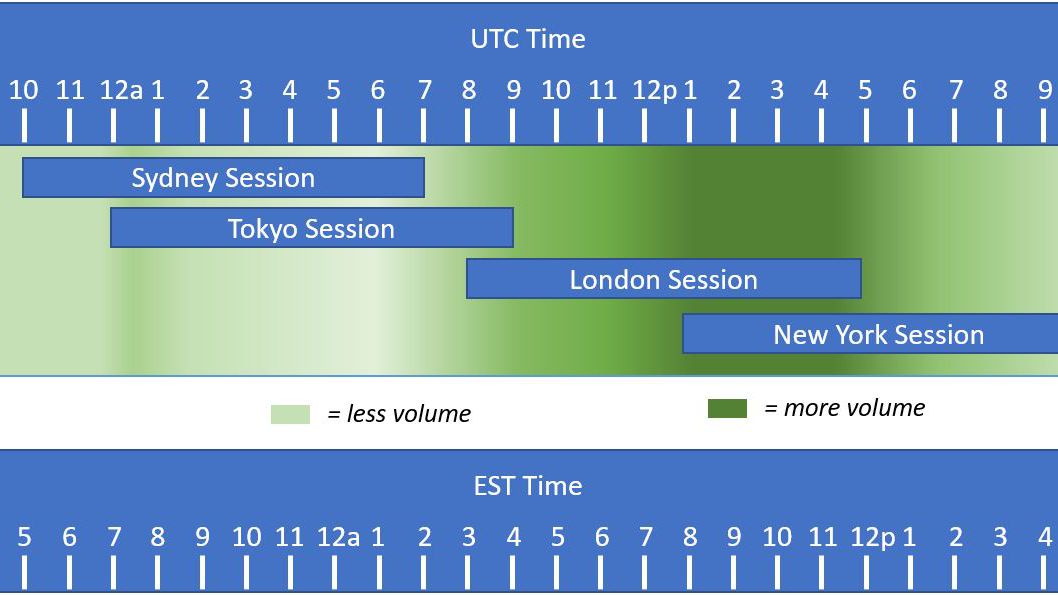
The international currency market is not dominated by single market exchanges, but it does include a global network of exchanges and brokers worldwide. Currency trading hours are based on when trading is open in each participating country. While the time zones overlap, the conventional time zone for each region is as follows:
New York is from 8am to 5pm EST (1pm to 10pm UTC)
Tokyo is from 7pm to 4am EST (12am to 9am UTC)
Sydney is from 5pm to 2am EST (10pm to 7am UTC)
London is from 3am to 12 noon EST (8pm to 5pm UTC)
The two busiest time zones from the listed above are London and New York. The period in which these two trading sessions overlap (afternoon in London and New York in the morning) is the busiest period and represents the bulk of the volume traded on the market at $ 5 trillion a day. It is during this period that the exchange rate of Reuters / WMR is determined. The rate, which is set at 4pm London time, is used for daily valuation and pricing for many money and retirement fund managers.
While the forex market is a 24/7 market, some currencies in several emerging markets are not traded 24/7. The seven most traded currencies in the world are the US dollar, the euro, the Japanese yen, the British pound and the Australian dollar, the Canadian dollar and the New Zealand dollar, all of which are traded continuously while the currency market is open.
Speculators usually trade in pairs that pass between these seven currencies from each country around the world, although they prefer times of heavier volume. When trading volumes are the heaviest forex brokers will provide a more stringent spread (bid and set prices closer together), which reduces transaction costs for traders. Similarly, institutional traders also prefer times with higher volume of trade, although they may accept a wider spread for being able to trade as early as possible in response to new information they have.
Despite the highly decentralized nature of the foreign exchange market, it remains an effective transfer mechanism for all participants and a broad access mechanism for those who wish to speculate anywhere in the world.
Disclaimer: The publications on this platform aim to provide useful information on financial topics. But they are NOT financial consultation or advice. Therefore they should not be used as a recommendation for making an investment decision on any type of financial products and services. We use in-depth research in the field but do not guarantee the completeness of the published materials. Always consult a specialist in your particular situation. "Applications In Life" Foundation is not responsible for any adverse consequences resulting from actions taken based on the information provided on the platform.