This publication aims to help fulfil the mission of “Applications In Life” Fondation to support and develop accessible and understandable financial education by improving financial culture and forward-thinking mentality of the civil society.
Every foreign exchange trader will use the Fibonacci retracement at some point in their trading career. Some will use it only occasionally, while others will use it regularly. But no matter how often you use this tool, the most important thing is to use it correctly every time.
Improper application of technical analysis methods will lead to disastrous results, such as poor entry points and growing losses on currency positions. Here we will look at how not to apply the Fibonacci retracement to the foreign exchange markets. Be aware of these common mistakes and you are likely to avoid making them – and enduring the consequences – in your trade.
- Don’t mix reference points
When adjusting the Fibonacci retracement to price action, it is always good to keep your reference points consistent. So, if you are referring to the lowest price of a trend at the end of the session or the body of the candle, the best high price should be available in the body of the candle at the top of the trend: body of candle to body of candle; wick to wick.
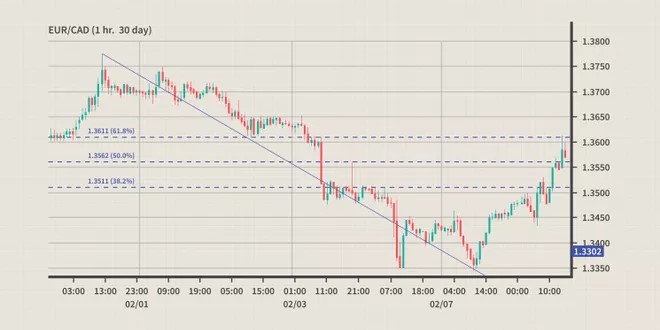
Incorrect analysis and errors are created after the reference points are mixed – moving from a candle wick to a candle body. Let’s look at an example in the Euro / Canadian dollar currency pair. The figure below shows the sequence. Fibonacci retracement is applied on a wick-to-wick basis, from the highest level of 1.3777 to the lowest level of 1.3344. This creates a clear resistance level at 1.3511, which is tested and then broken.
On the other hand, the figure below shows inconsistency. Fibonacci retracement is applied by a high closure of 1.3742 (35 pips below the high level of the wick). This causes the resistance level to cut several candles (between February 3 and February 7), which is not a large reference level.
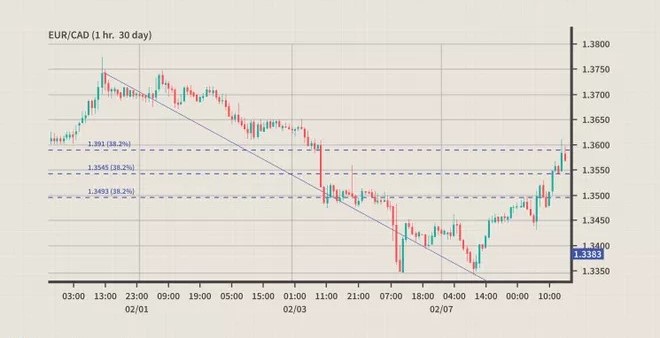
By maintaining it consistently, levels of support and resistance will become more apparent to the naked eye, speeding up analysis and leading to faster deals.
- Don’t ignore long-term trends
New traders often try to measure significant movements and withdrawals in the short term, without considering the bigger picture. This narrow perspective makes short-term deals more than a little wrong. Following the long-term trend, the trader can apply the Fibonacci reatracement in the right direction of inertia and tune in to great opportunities.
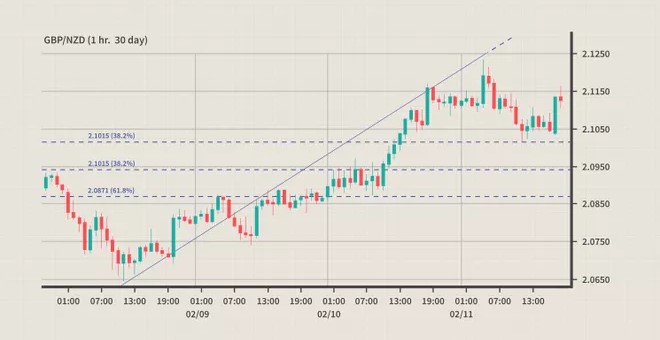
In the figure below, we find that the long-term trend in the British pound / New Zealand dollar is upward. We apply Fibonacci and we see that our first level of support is 2.1015, or the Fibonacci level of 38.2% from 2.0648 to 2.1235. This is the perfect place for a long time in the currency pair.
The picture looks very different, if we look at it in the short term.
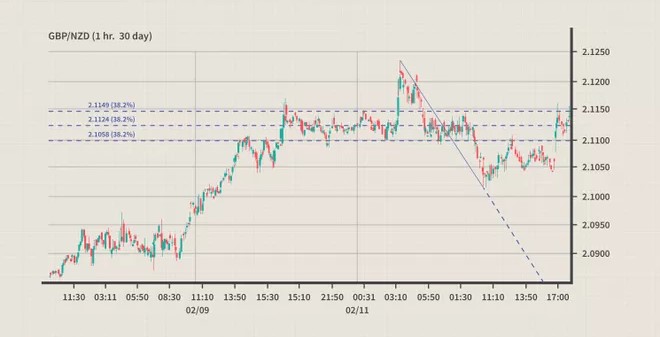
After the rise of the currency pair, we can see a potential short opportunity in the five-minute time frame (above). This is the trap. By not sticking to the long term, the short seller applied Fibonacci from a peak of 2.1215 to a low of 2.1024 (February 11), leading to a short position at 2.1097 or 38% Fibonacci.
This short trade brings the trader a good profit of 50 pips, but comes at the expense of the next advance of 400 pips. A better plan would be to enter a long position in the GBP / NZD pair with short-term support of 2.1050.
- Don’t rely on Fibonacci alone
Fibonacci can provide reliable trading settings, but not without confirmation.
The application of additional technical instruments such as MACD or stochastic oscillators will support the possibility of trading and increase the likelihood of good trading. Without these methods acting as confirmation, the trader has little more than hope for a positive result.
In the figure below we see a correction of the medium-term rise of the currency pair Euro / Japanese yen. From 10 January 2011, the EUR / NZD exchange rate rose to its highest level of 113.94 in almost two weeks. Applying our Fibonacci retracement sequence, we reach a correction level of 38.2% of 111.42 (from the top of 113.94). After lowering the retracement, we notice that the stochastic oscillator also confirms the lower pulse.
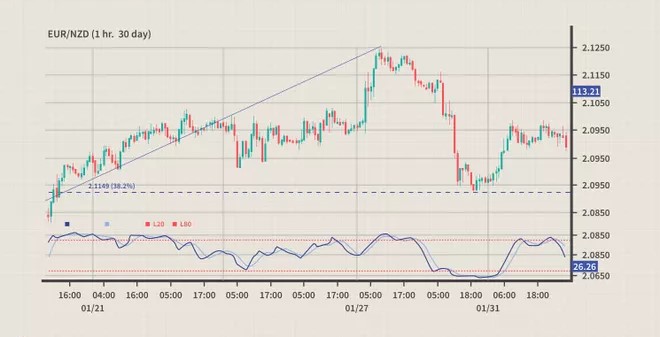
Now the opportunity comes to life as price action tests our Fibonacci retracement level at 111.40 on January 30th. Seeing this as an opportunity for a long time, we confirm the price point with a stochastic, which shows a signal of oversold. A trader holding this position would gain almost 1.4%, or 160 pips, as the price jumped from 111.40 and traded to 113 over the next few days.
- Using Fibonacci for short-term
Daily trading in the foreign exchange market is exciting, but there is a lot of volatility.
For this reason, applying Fibonacci retracement for a short period of time is ineffective. The shorter the time period, the less reliable the retracement levels. Volatility can and will distort levels of support and resistance, making it very difficult for a trader to choose which levels can be traded. Not to mention in the short term, spikes and bumps are very common. This dynamic can make it especially difficult to set stops or take profit points, as the adjustment can create narrow and narrow mergers. Just look at the example of the Canadian dollar / Japanese yen below.
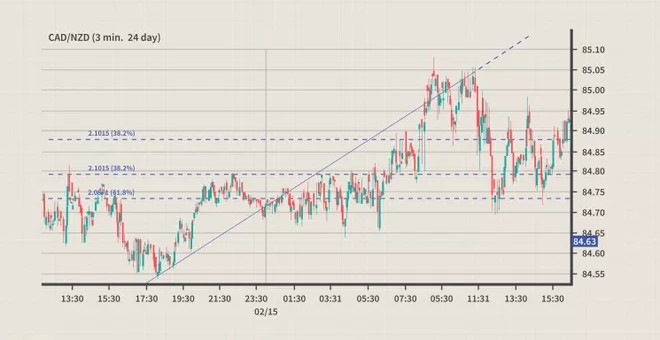
In the figure above, we try to apply Fibonacci to intraday movement in the CAD / JPY exchange rate chart (using three minutes for each candle). Here the volatility is high. This causes longer wicks in price action, creating the potential for incorrect analysis of certain levels of support. It also doesn’t help that our Fibonacci levels are separated by an average of just six pips, which increases the likelihood of them being stopped.
Remember, as in any other statistical survey, the more data used, the stronger the analysis. Adhering to longer time frames when applying Fibonacci sequences can improve reliability at any price level.
The bottom line
As with any major, it takes time and practice to become better at using Fibonacci correction in forex trading. Don’t be disappointed – long-term rewards outweigh the costs. Follow the simple rules for applying Fibonacci retracement and learn from these common mistakes to help you analyze profitable opportunities in foreign exchange markets.
Disclaimer: The publications on this platform aim to provide useful information on financial topics. But they are NOT financial consultation or advice. Therefore they should not be used as a recommendation for making an investment decision on any type of financial products and services. We use in-depth research in the field but do not guarantee the completeness of the published materials. Always consult a specialist in your particular situation. "Applications In Life" Foundation is not responsible for any adverse consequences resulting from actions taken based on the information provided on the platform.


