This publication aims to help fulfil the mission of “Applications In Life” Fondation to support and develop accessible and understandable financial education by improving financial culture and forward-thinking mentality of the civil society.
What Is a cup and handle?
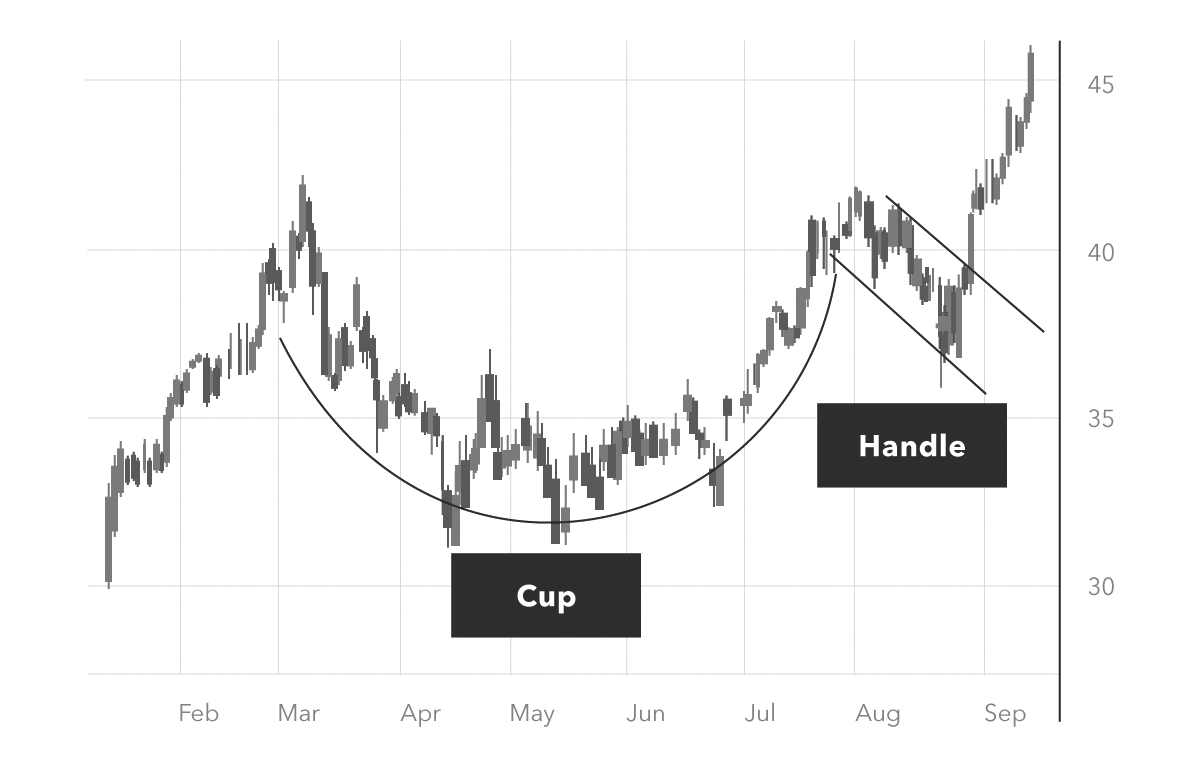
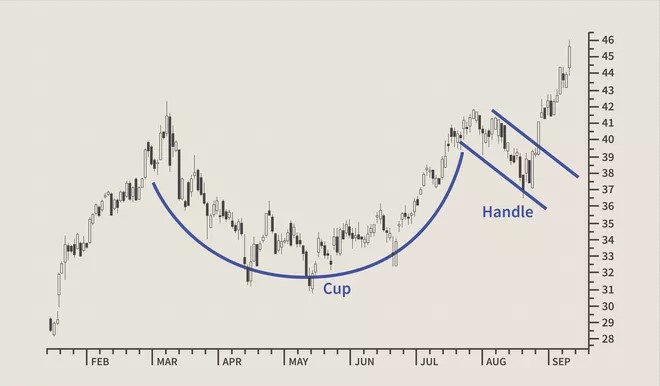
Price model of a cup and handle in the price chart of a security is a technical indicator that resembles a cup with a handle, where the cup is in the shape of “u” and the handle has a slight downward deflection. The cup and handle are considered a bullish signal, with the right side of the model usually having a lower trading volume. Model formation can be as short as seven weeks or up to 65 weeks.
What does a cup and handle tell you?
American technician William J. O’Neill defined the cup and handle (C&H) model in his 1988 classic How to make money in stocks by adding technical requirements through a series of articles published in Investor’s Business daily, which he founded in 1984. “Neil included time measurements for each component, as well as a detailed description of the rounded low values that give the model its unique cup shape.
As the stocks that make up this model test old peaks, they are likely to cause sales pressure from investors who have previously bought at these levels; The pressure on sales is likely to cause the price to consolidate with a downward trend for a period of four days to four weeks before rising. A cup and a handle are considered a bullish pattern of continuation and are used to identify buying opportunities.
It is worth keeping the following in mind when finding models of cups and handles:
- Length: Generally, cups with longer and more U-shaped bottoms provide a stronger signal. Avoid glasses with sharp “V” bottoms.
- Depth: Perfectly, the cup should not be too deep. Also avoid handles that are too deep, as the handles should form in the upper half of the cup model.
- Volume: The volume should decrease with decreasing prices and remain lower than the average at the base of the bowl; then you need to increase when the stock starts to move higher, go back to test the previous high.
No re-test of previous resistance is required to touch or come within a few tickets of the old maximum; however, the further the upper part of the handle from the high ones, the more significant the breakthrough should be.
Example of how to use the cup and handle
The image below depicts a classic cup and handle layout. Place a stop purchase order just above the top trend line on the handle. The execution of the order should take place only if the price breaks the resistance of the model. Traders may experience excessive slippage and make a false breakthrough using an aggressive entrance. Alternatively, wait for the price to close above the upper trend line of the manipulator, then place a limit order just below the breakout level of the model, trying to get performance if the price comes back. There is a risk of missing the deal if the price continues to rise and does not retreat.
The profit target is determined by measuring the distance between the bottom of the cup and the breakout level of the model and extending this distance upwards from the breakthrough. For example, if the distance between the bottom of the cup and the breakout level of the handle is 20 points, the profit target is placed 20 points above the handle of the template. Stop-loss orders can be placed either under the handle or under the cup, depending on the trader’s risk tolerance and market volatility.
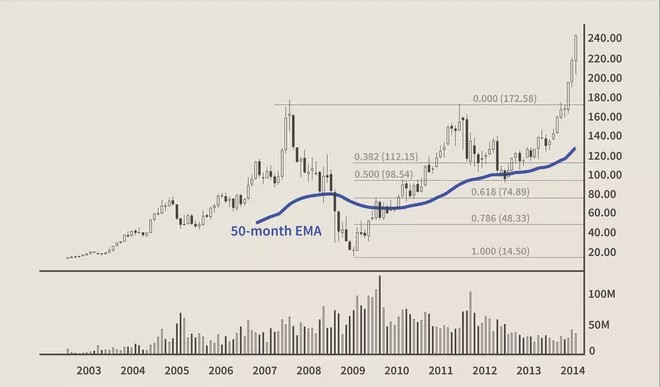
Now let’s look at a real-world historical example using Wynn Resorts, Limited (WYNN), which went public on the Nasdaq near $ 13 in October 2002 and rose to $ 154 five years later. The subsequent decline ended within two points of the initial public offering (IPO) price, far exceeding O’Neil’s requirement for a shallower glass, the highest in the previous trend. The next wave of recovery reached its previous peak in 2011, almost 10 years after the first seal. The handle follows the classic expectation of withdrawal, finding support at 50% correction in a rounded shape and returns to a maximum for the second time 14 months later. Shares exploded in October 2013, adding 90 points over the next five months.
Limitations of the cup and handle
Like all technical indicators, the cup and handle must be used in conjunction with other signals and indicators before deciding to trade. In particular, with the cup and the handle, some limitations have been identified by practitioners. The first is that it may take some time for the model to be fully formed, which can lead to late decisions. While one month to one year is the typical time to shape a cup and handle, this can also happen quite quickly or take several years to establish, which makes it ambiguous in some cases.
Another issue is related to the depth of the cup of the formation. Sometimes a shallower glass can be a signal, while other times a deeper glass can produce a false signal. Sometimes the cup is formed without the characteristic handle. Finally, one limitation shared in many technical models is that it can be unreliable for illiquid stocks.
What does a cup and handle pattern indicate?
A cup and a handle are a technical indicator in which the movement of the price of a security resembles a “cup”, followed by a descending price model. This decline or “handle” is intended to signal the possibility of buying long-term securities. When this part of price formation is over, the security can reverse the course and reach new heights. Usually models of cups and handles fall between seven weeks to more than a year.
Is a cup and handle pattern bullish?
As a general rule, cup and handle models are ascending price formations. The founder of the term, William O’Neill, identified four main stages of this technical model of trade. First, approximately one to three months before the “cup” model begins, the security will reach a new peak in an upward trend. Second, security will go back, falling no more than 50% of the previous maximum, creating a rounded bottom. Third, security will return to its previous maximum, but will subsequently decrease, forming the “handle” part of the formation. Finally, security explodes again, surpassing its peaks, which are equal to the depth of the low point of the cup.
How do you find a cup and handle pattern?
Consider a scenario in which stocks recently peaked after a significant boost, but then adjusted, falling by almost 50%. At this point, the investor can buy the shares, expecting that they will return to previous levels. The stocks then recovered, testing the previous high levels of resistance, and then fell into a sideways trend. In the last stage of the model, stocks exceeded these resistance levels, rising 50% above the previous high.
Disclaimer: The publications on this platform aim to provide useful information on financial topics. But they are NOT financial consultation or advice. Therefore they should not be used as a recommendation for making an investment decision on any type of financial products and services. We use in-depth research in the field but do not guarantee the completeness of the published materials. Always consult a specialist in your particular situation. "Applications In Life" Foundation is not responsible for any adverse consequences resulting from actions taken based on the information provided on the platform.