This publication aims to help fulfil the mission of “Applications In Life” Fondation to support and develop accessible and understandable financial education by improving financial culture and forward-thinking mentality of the civil society.
What is the price rate of change (ROC) Indicator
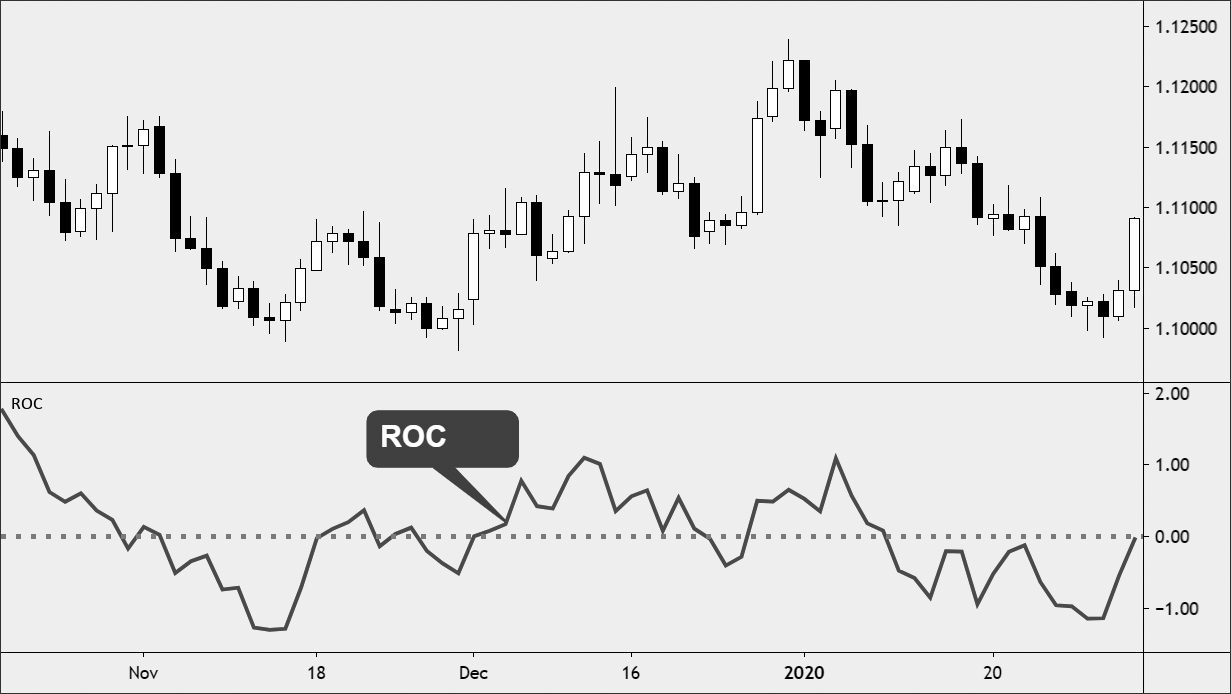
The rate of change of the price (ROC) is a technical indicator based on momentum, which measures the percentage change in the price between the current price and the price before a certain number of periods. The ROC indicator is plotted relative to zero, with the indicator moving up in positive territory if price changes are up, and moving in negative territory if price changes are downward.
The indicator can be used to detect divergences, overbought and oversold conditions and centerline crossing.
The formula for the price rate of change indicator Is:
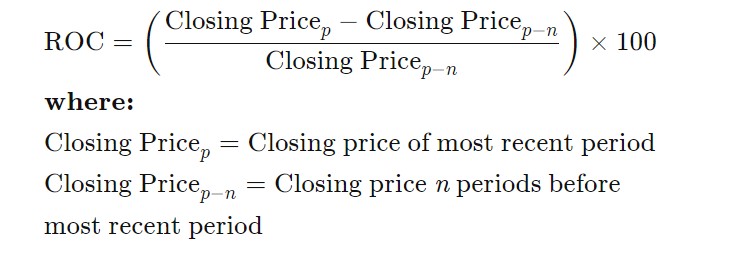
How to calculate the price rate of change indicator
The main step in calculating the ROC is to select the value “n”. Short-term traders can choose a small value of n, such as nine. Long-term investors can choose a value like 200. The value of n is how long before the current price is compared. Smaller values will make the ROC react faster to changes in prices, but this could also mean more false alarms. A higher value means that the ROC will react more slowly, but the signals may be more meaningful when they appear.
- Select a value of n. It can be anything like 12, 25 or 200. Short-term traders usually use a smaller number, while long-term investors use a larger number.
- Find the closing price of the last period.
- Find the closing price of the period before the n period.
- Include the prices of steps two and three in the ROC formula.
- When each period is over, calculate the new ROC value.
What does the price rate of change indicator tell you?
Price rate of change (ROC) is classified as an indicator of momentum or speed, as it measures the strength of the price momentum through the rate of change. For example, if the stock price at the end of trading today is $ 10, and the closing price five trading days before was $ 7, then the five-day ROC is 42.85, calculated as
((10−7)÷7)×100=42.85
Like most pulse oscillators, the ROC appears on the chart in a separate window below the price chart. ROC is applied against the zero line, which distinguishes between positive and negative values. Positive values indicate an upward pressure or momentum when buying, while negative values below zero indicate an upward pressure or a downward momentum. Increasing the values in any direction, positive or negative, indicates an increasing pulse, and reversing to zero indicates a decreasing pulse.
Zero-line crossovers can be used to signal changes in the trend. Depending on the value of n used, this signal may come early when the trend changes (low value n) or very late when the trend changes (higher value n). ROC is prone to shocks, especially around the zero line. Therefore, this signal is not usually used for commercial purposes, but rather simply to warn traders that there may be a change in the trend.
The levels of overbought and oversold are also used. These levels are not fixed, but will vary depending on the asset being traded. Traders are looking to see what ROC values have led to price reversals in the past. Traders will often find both positive and negative values where the price reverses with some regularity. When the ROC reaches these extreme readings again, traders will be vigilant and watch the price begin to turn to confirm the ROC signal. In the presence of an ROC signal and a reversal of the price, a transaction may be considered to confirm the ROC signal.
ROC is also often used as an indicator of divergence, which signals a possible impending change in the trend. Divergence occurs when the price of a stock or other asset moves in one direction while its ROC moves in the opposite direction. For example, if the stock price rises for a certain period of time while the ROC is progressively moving lower, then the ROC shows a downward deviation from the price, which signals a possible change in the downward trend. The same concept applies if the price moves down and the ROC moves higher. This may signal an upward movement in the price. Divergence is a known signal of a bad moment, as divergence can last a long time and does not always lead to a reversal of the price.
The difference between the price rate of change and the momentum indicator
The two indicators are very similar and will give similar results if you use the same value of n in each indicator. The main difference is that the ROC divides the difference between the current price and the price before the n period of the price before the n period. That makes it a percentage. Most inertia indicator calculations do not. Instead, the price difference is simply multiplied by 100 or the current price is divided by the price before n periods and then multiplied by 100. Both indicators end up telling similar stories, although some traders may slightly prefer one over the other. because they may provide slightly different readings.
Limitation of using the price rate of change indicator
One potential problem with the use of the ROC indicator is that its calculation gives equal weight to the latest price and the price before the n period, despite the fact that some technical analysts believe that more recent price action is more important in determining of the probable future price movement.
The indicator is also prone to shocks, especially around the zero line. This is because when the price consolidates, price changes shrink, moving the indicator to zero. Such moments can lead to many false signals for trend trades, but they help to confirm the consolidation of the price.
While the indicator can be used for divergence signals, the signals often appear too early. When the ROC starts to deviate, the price may still be moving in the direction of the trend for some time. Therefore, divergence should not act as a trade signal, but can be used to confirm trade if there are other signals of reversal from other indicators and methods of analysis.
The bottom line
- The Price Rate of Change (ROC) oscillator is an indicator of unlimited momentum used in technical analysis set against a midpoint at zero.
- A rising ROC above zero usually confirms an upward trend, while a falling ROC below zero indicates a downward trend.
- When the price consolidates, the ROC will move close to zero. It is important for traders, in this case, to monitor the overall price trend, as the ROC will provide little information other than to confirm the consolidation.
Disclaimer: The publications on this platform aim to provide useful information on financial topics. But they are NOT financial consultation or advice. Therefore they should not be used as a recommendation for making an investment decision on any type of financial products and services. We use in-depth research in the field but do not guarantee the completeness of the published materials. Always consult a specialist in your particular situation. "Applications In Life" Foundation is not responsible for any adverse consequences resulting from actions taken based on the information provided on the platform.