
This publication aims to help fulfil the mission of “Applications In Life” Fondation to support and develop accessible and understandable financial education by improving financial culture and forward-thinking mentality of the civil society.
Technical indicators are used by traders to get an idea of the supply and demand of securities and the psychology of the market. The basis of technical analysis is formed by these indicators together. Metrics, such as trading volume, provide clues as to whether price movements will continue. In this way, indicators can be used to generate buy and sell trading ideas. In this list, you will learn about seven technical indicators to add to your trading tools. You don’t have to use all of them, rather choose a few that you find to help you make better position decisions.
Tools of the Trade
Trading tools for day traders and technical analysts consist of graphical tools that generate buy or sell trading ideas or that show market trends or patterns. Generally speaking, technical indicators are two main types:
- Overlays: Technical indicators that use the same scale as prices are plotted above the top of the prices on a stock chart. Examples include Bollinger Bands lines or Fibonacci lines and moving averages.
- Oscillators: In this article we will look mainly at oscillators type of technical indicators. They are technical indicators that fluctuate between a local minimum and a maximum are plotted above or below the price chart, instead of superimposing on a price chart, . Examples include MACD or RSI and stochastic oscillator.
When analyzing a security, traders often use several different technical indicators in combination. With literally thousands of different options, retailers need to choose the most appropriate indicators for them and learn how they work. Technical indicators with more subjective forms of technical analysis can be combined by traders, such as looking at chart diagrams, to come up with trading ideas. Technical indicators may also be included in automated trading systems, taking into account their quantitative nature.
- On-Balance Volume
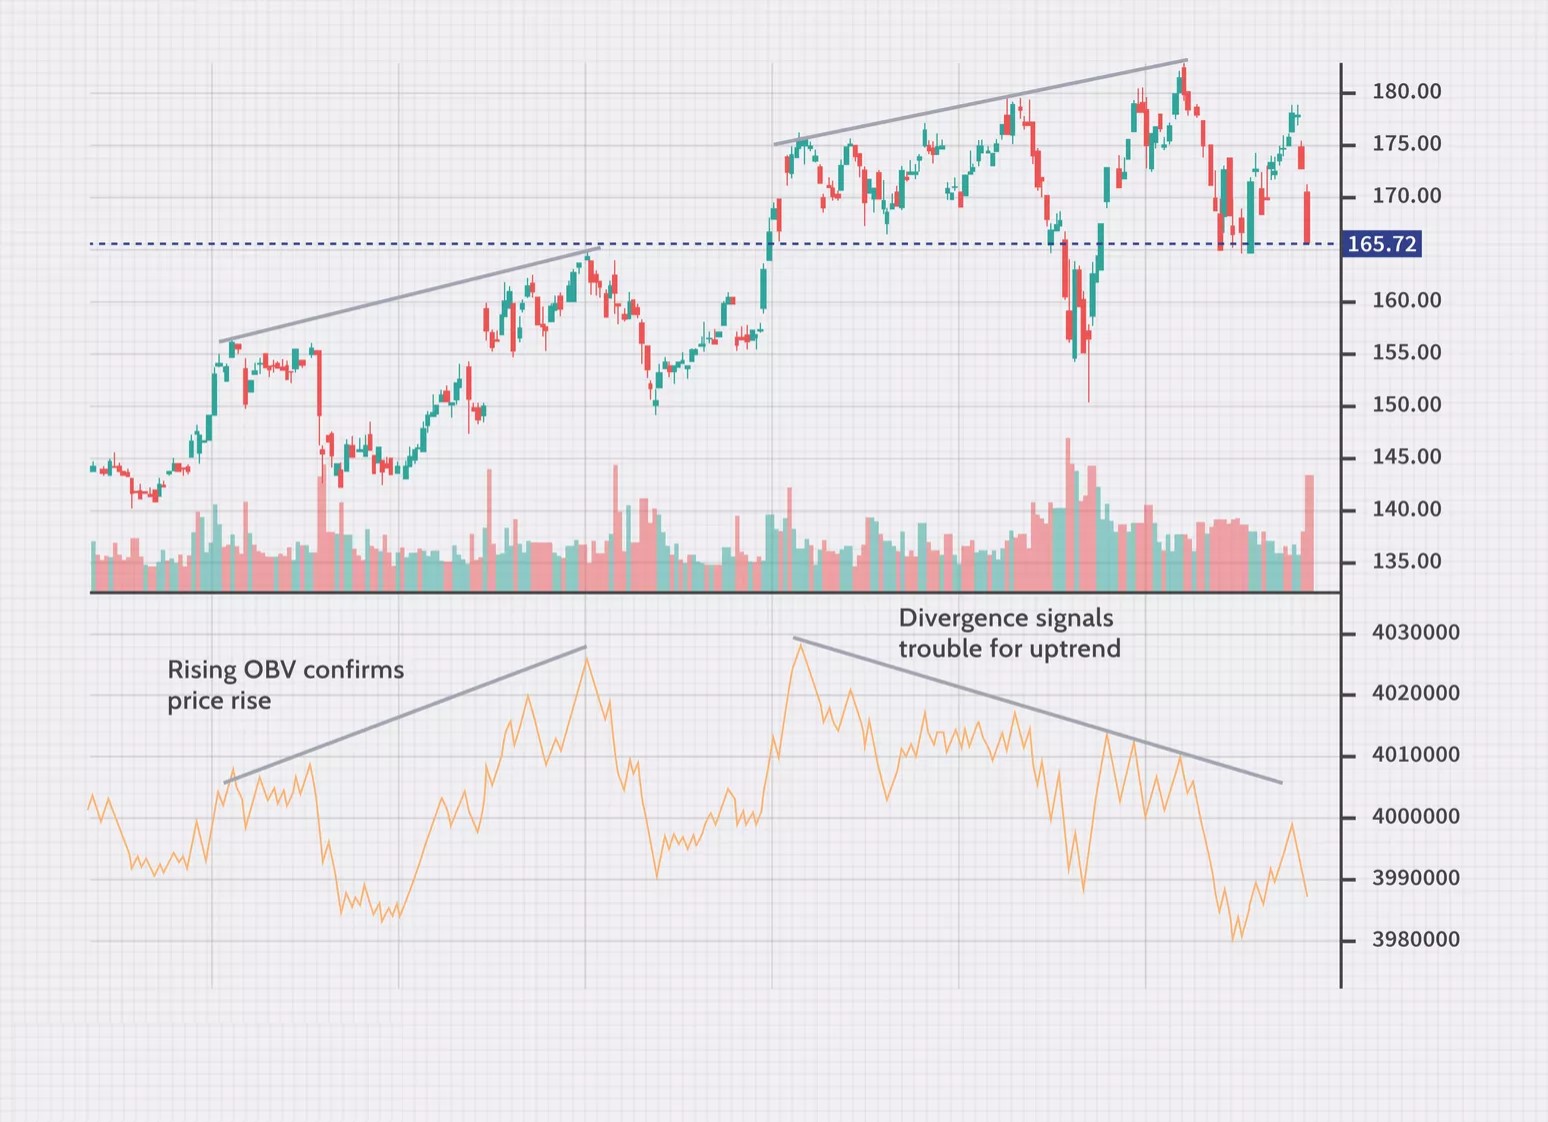
First, use the volume balance indicator (OBV) to measure the positive and negative volume flow in the security over time.
The indicator is the current amount of increased volume minus down. The increasing volume is how much volume there is on the day when the price rises. Reduced volume is the volume on the day when the price falls. Each daily volume is added or subtracted from the indicator based on whether the price is higher or lower.
When OBV rises, it shows that buyers are willing to intervene and raise the price higher. When OBV falls, sales volume outpaces purchase volume, indicating lower prices. In this way, it acts as a tool to confirm trends. If the price and OBV rise, this helps to indicate a continuation of the trend.
Dealers who use OBV also watch for divergence. This happens when the indicator and the price move in different directions. If the price rises but the OBV falls, it may mean that the trend is not supported by strong buyers and may soon reverse.
- Accumulation/Distribution Line
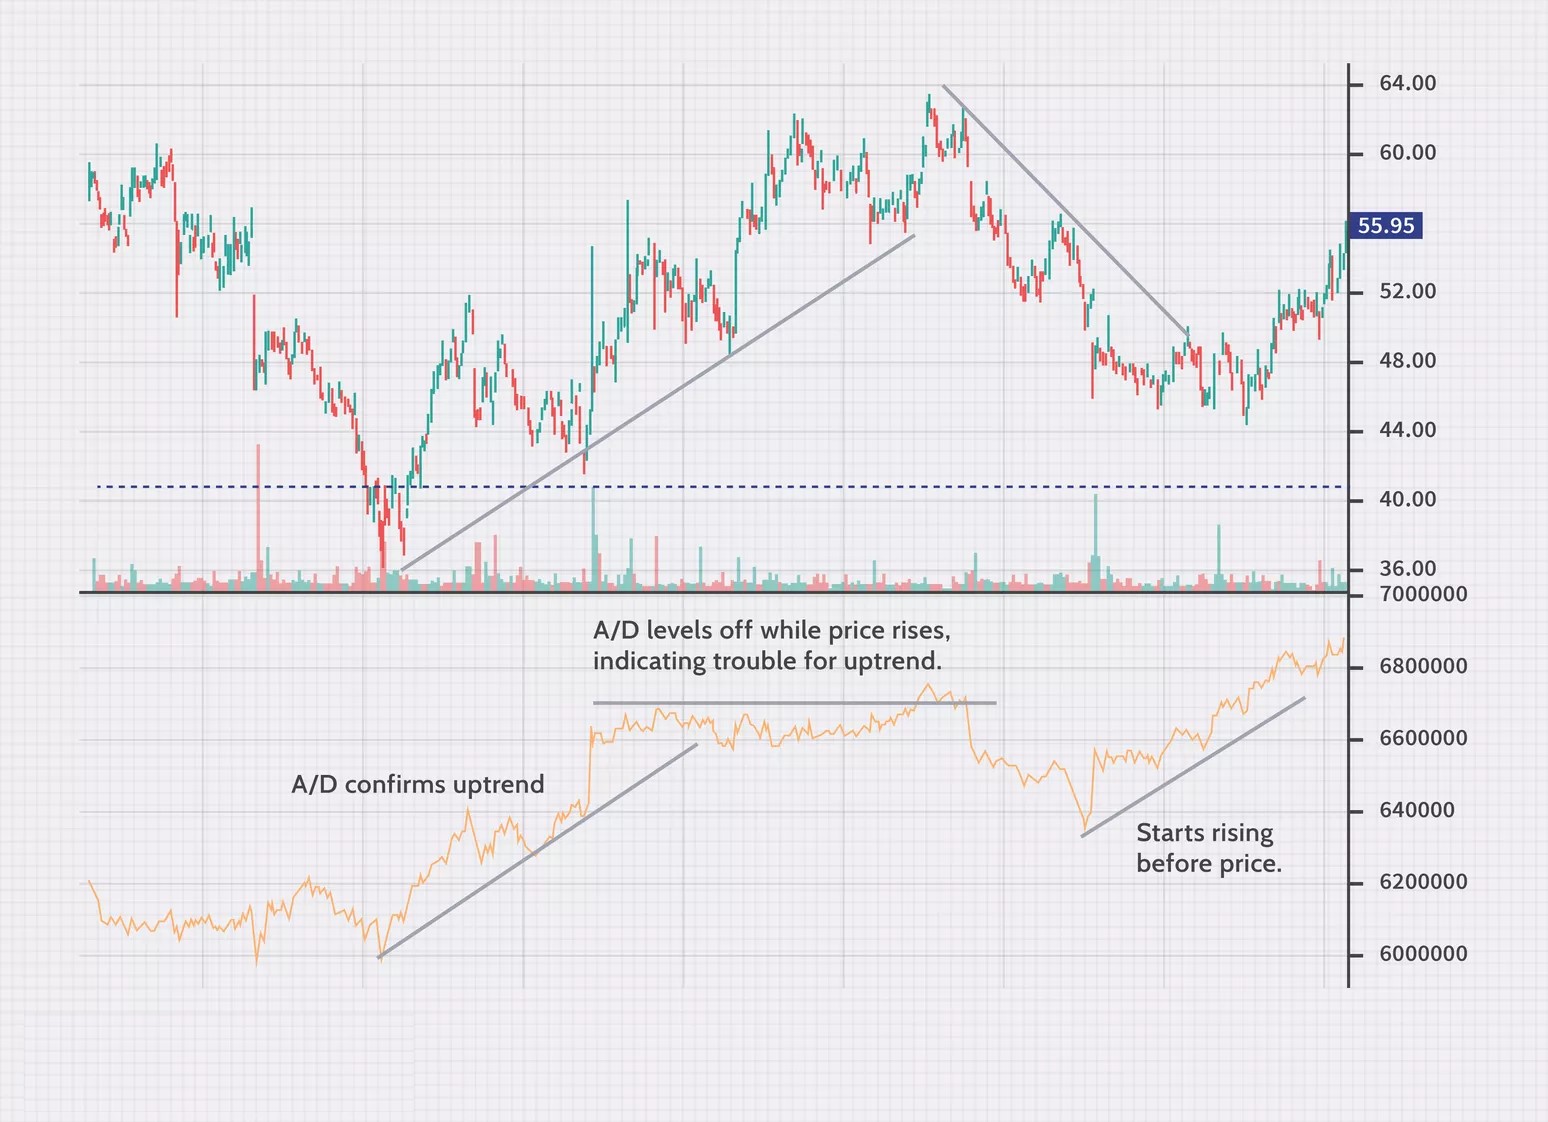
One of the most commonly used indicators for determining cash flow in and out of a security is the accumulation / distribution line (A / D line).
It is similar to the balance sheet volume indicator (OBV), but instead of looking only at the closing price of the security for the period, it also takes into account the trading range for the period and where the closing is in relation to that range. If the stock ends near its maximum, the indicator gives more volume than if it closes close to the midpoint of its range. Different calculations mean that OBV will work better in some cases and A / D will work better in others.
If the indicator line is in an upward trend, this indicates interest in buying, as the shares close more than half of the range. This helps to confirm an uptrend. On the other hand, if the A / D falls, it means that the price ends at the bottom of its daily range and thus the volume is considered negative. This helps to confirm a downward trend.
Traders using the A / D line also watch for deviations. If the A / D starts to fall while the price rises, it signals that the trend is in trouble and may be reversed. Similarly, if the price tends to be lower and the A / D starts to rise, this may signal the coming of higher prices.
- Average Directional Index
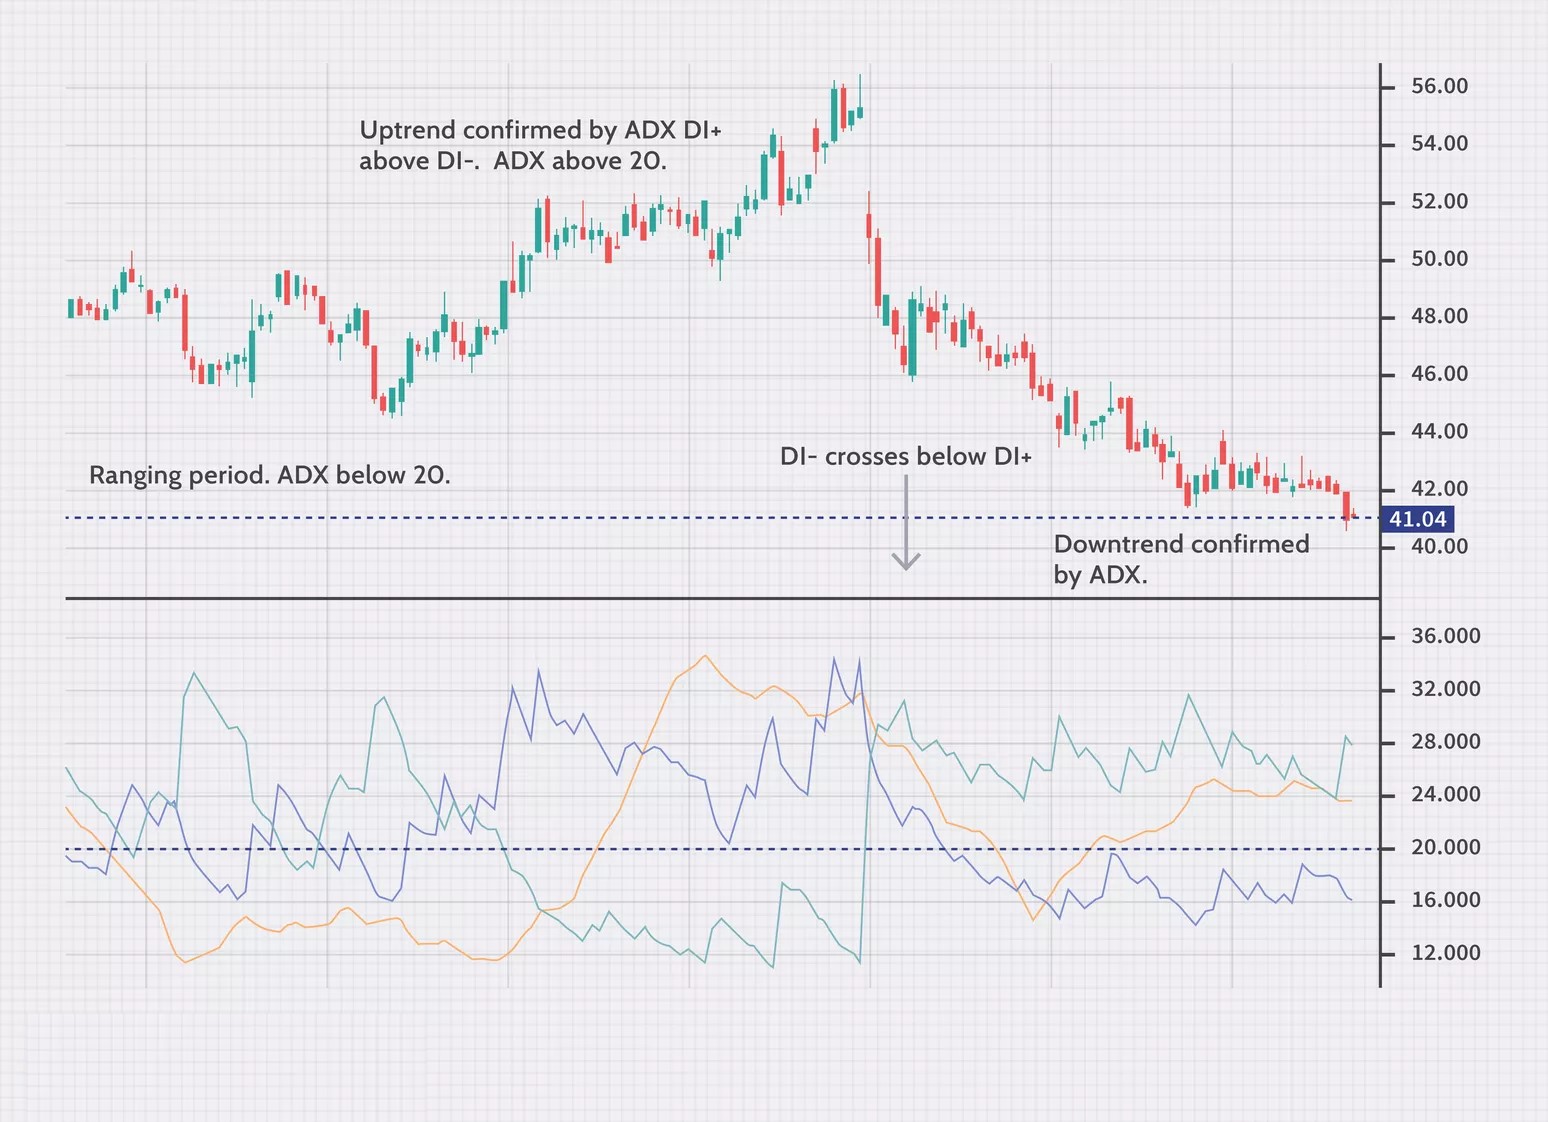
The average target index (ADX) is a trend indicator used to measure the strength and momentum of a trend. When the ADX is above 40, The trend is considered to have a lot of directional force, when the ADX is above 40, up or down, depending on the direction in which the price is moving. When the ADX indicator is below 20, the trend is considered weak or non-trend.
ADX is the main line of the indicator, usually colored in black. Optionally, there are two additional lines that can be displayed – DI + and DI-. Respectively, these lines are often colored red and green. All three lines work together to show momentum of the trend as well as the direction of the trend.
- ADX over 20 and DI + over DI-: This is an uptrend.
●ADX over 20 and DI- over DI +: This is a downward trend.
●ADX below 20 is a weak trend or period of range, often associated with DI- and DI +, which intersect rapidly.
- Aroon Indicator
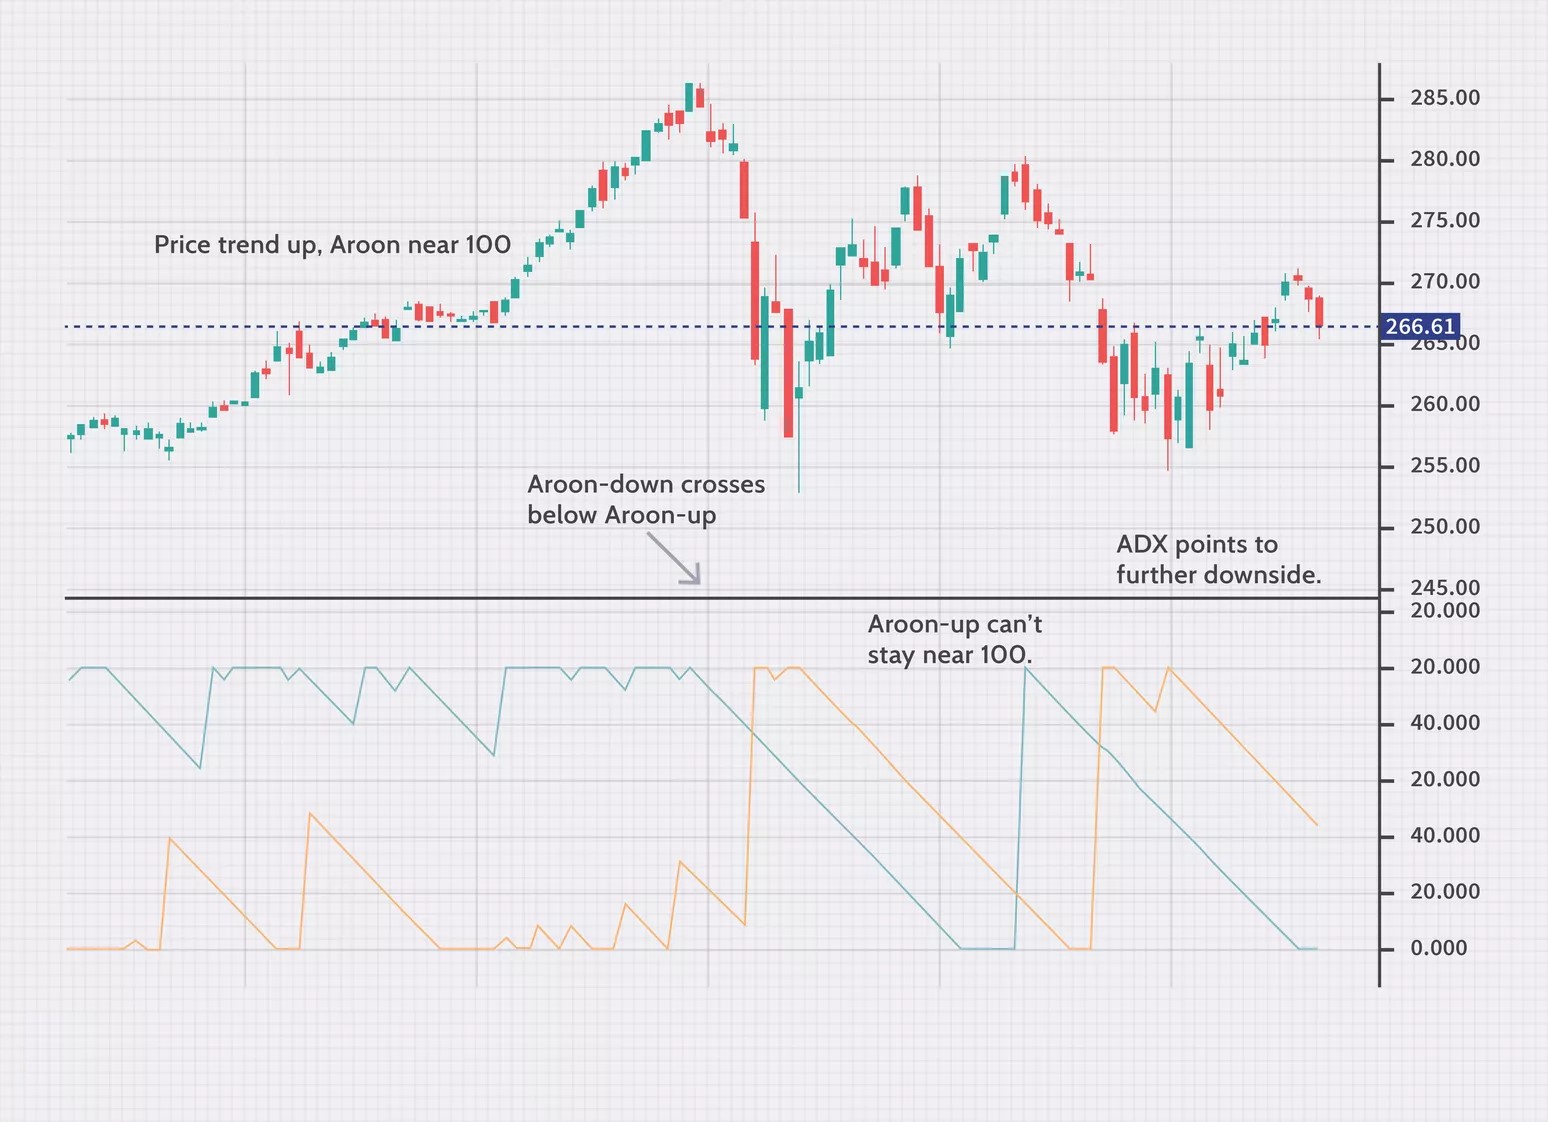
The Aroon oscillator is a technical indicator used to measure whether a security is in trend and, more specifically, whether the price is reaching new highs or lows during the calculation period (usually 25).
The indicator can also be used to identify when a new trend should start. The Aroon indicator consists of two lines: the Aroon-up line and the Aroon-down line.
When Aroon-up goes over Aroon-down, this is the first sign of a possible change in the trend. If Aroon-up reaches 100 and remains relatively close to this level, while Aroon-down remains close to zero, this is a positive confirmation of an upward trend.
The opposite is also true. If Aroon-down passes over Aroon-up and remains close to 100, this indicates that the downward trend is in force.
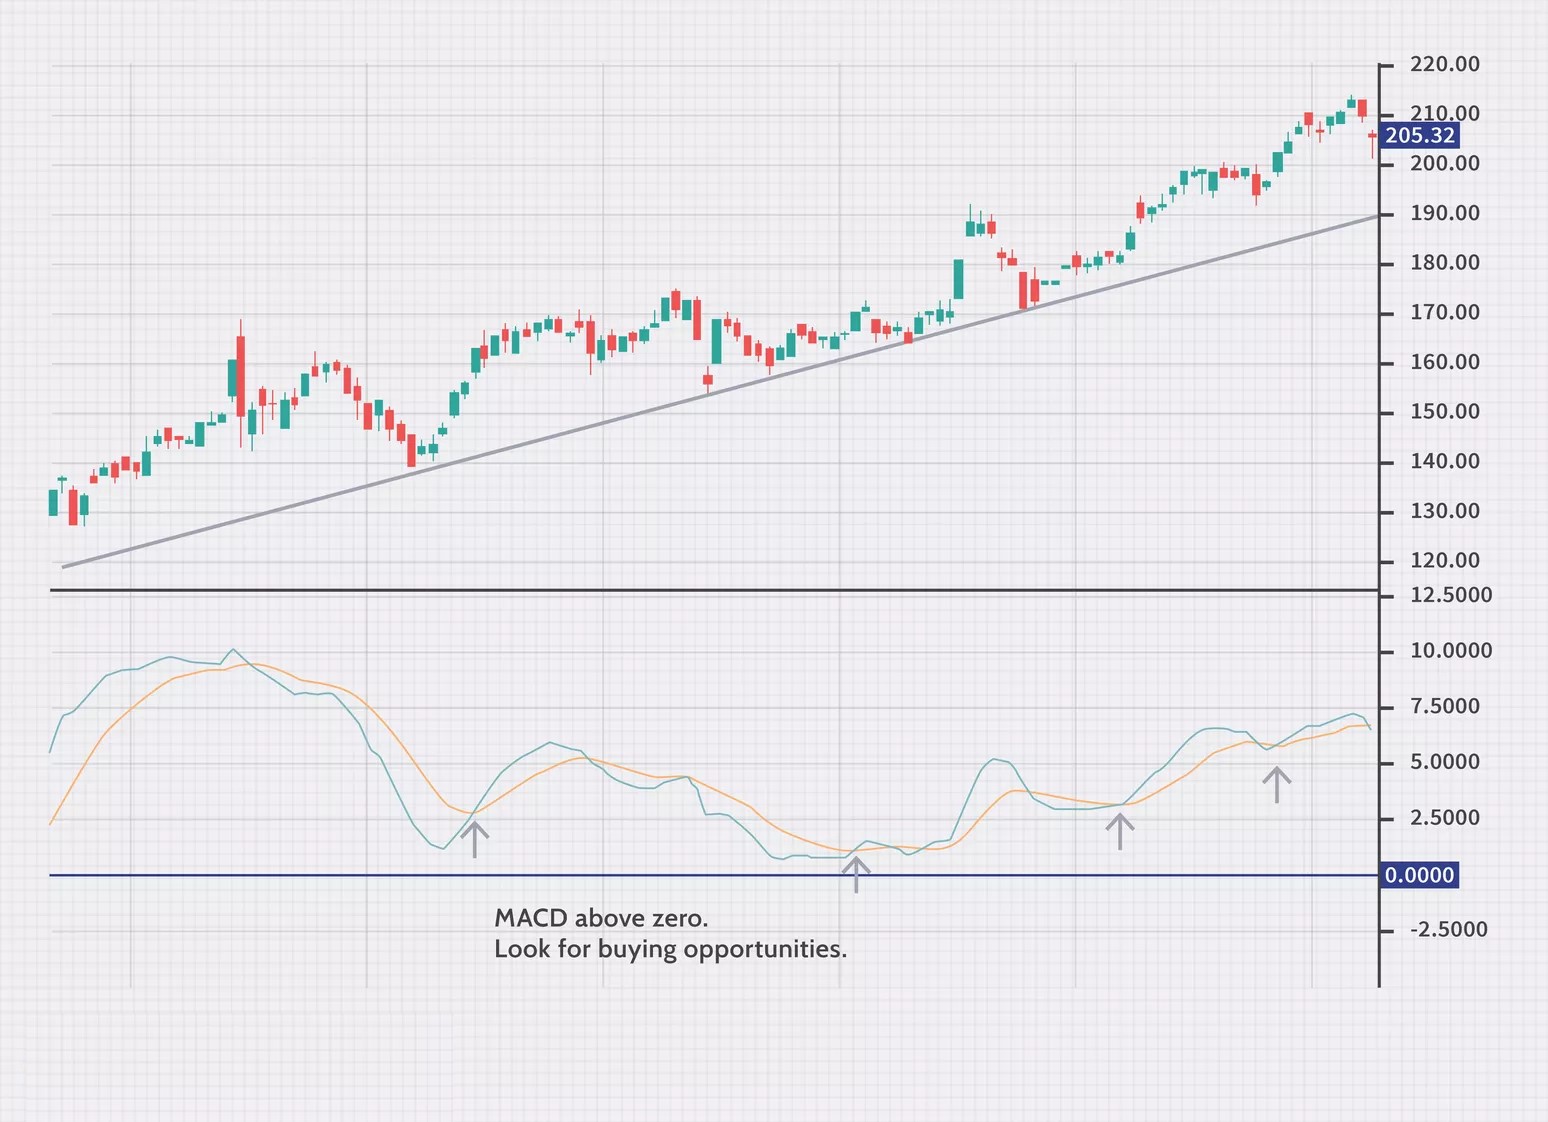
- MACD
The Moving Average Convergence Convergence Indicator (MACD) helps traders see the direction of a trend as well as the momentum of that trend. It also provides a number of trading signals.
If the MACD is above zero, the price is in an upward phase. When the MACD is below zero, it has entered a bearish period.
The indicator consists of two lines: the MACD line and a signal line that moves more slowly. When the MACD passes below the signal line, this indicates that the price is falling. When the MACD line crosses the signal line, the price rises.
By looking at which side of the zero, the indicator helps determine which signals to follow. For example, if the indicator is above zero, make sure the MACD goes over the signal line to buy. If the MACD is below zero, crossing the MACD below the signal line may provide a signal for a possible short trade.
- Relative Strength Index
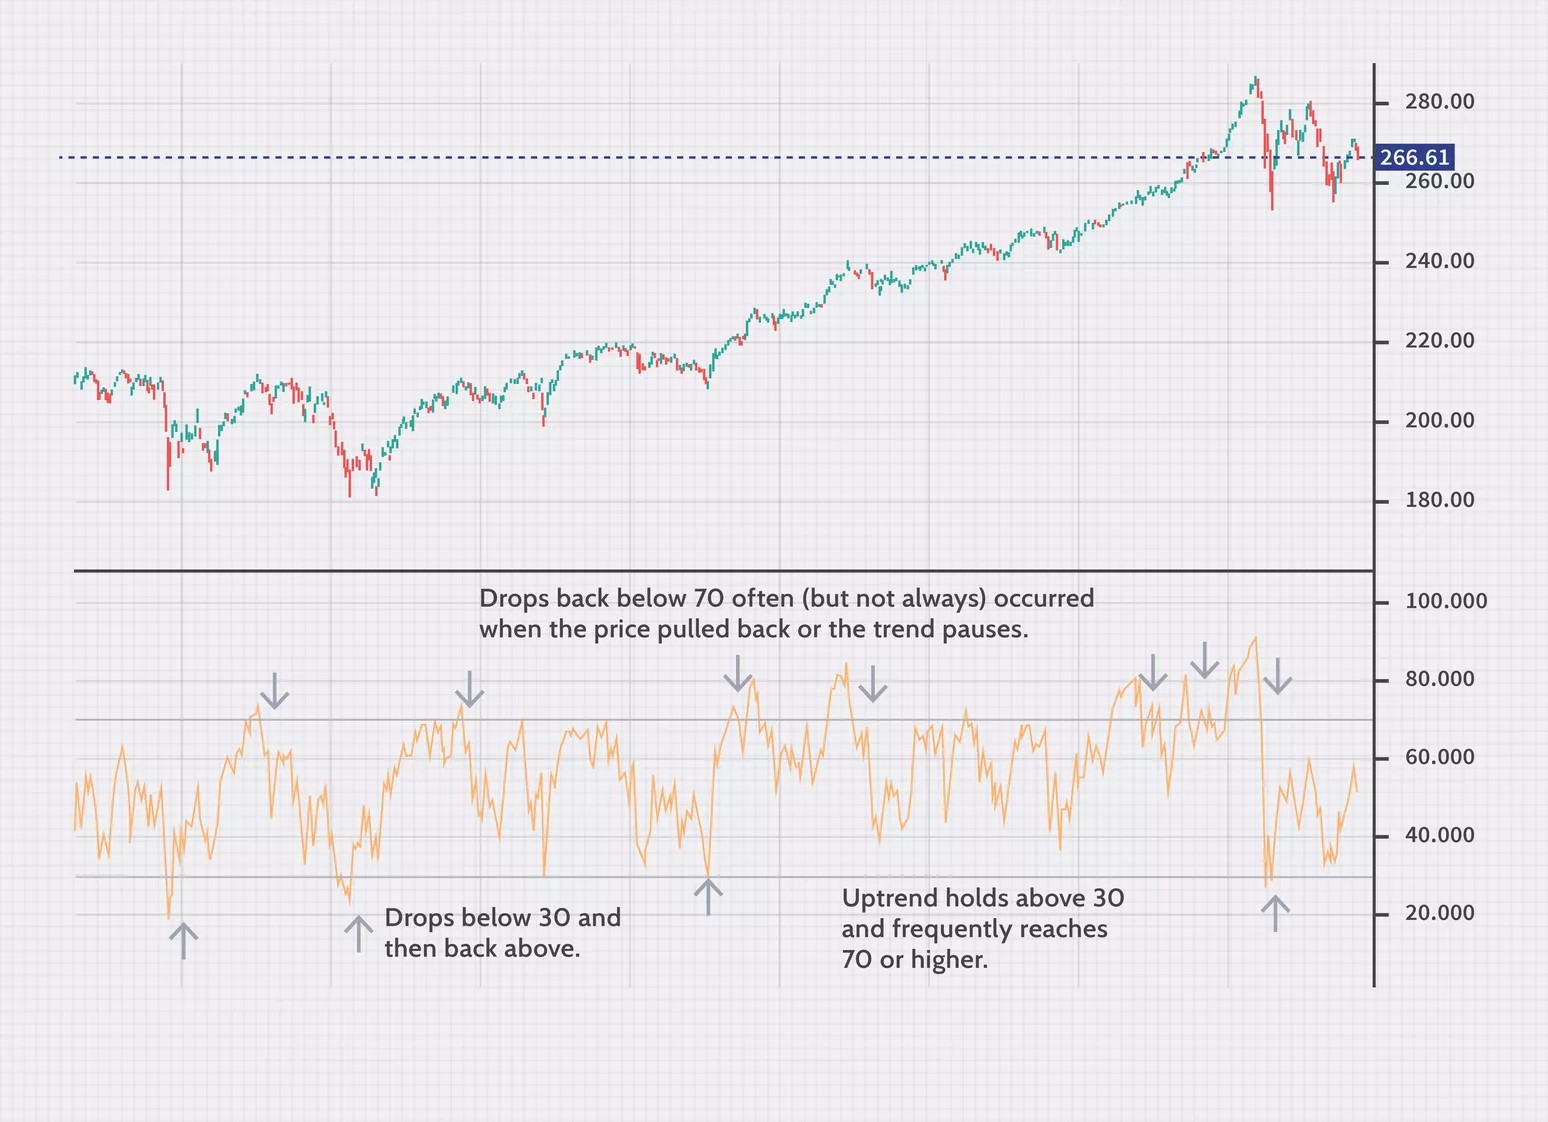
The Relative Strength Index (RSI) has at least three main applications. The indicator ranges between zero and 100, plotting the last price gains relative to the last price losses. Therefore, RSI levels help to measure the momentum and strength of the trend.
The most basic use of RSI is as an indicator of overbought and resale. When the RSI is above 70, the asset is considered overbought and may decrease. When the RSI is below 30, the asset is resold and may increase. Making this assumption is dangerous. Therefore, some traders wait for the indicator to rise above 70 and then fall below before selling, or to fall below 30 and then rise again before buying.
Divergence is another use of RSI. When the indicator moves in a different direction from the price, it shows that the current price trend is weakening and may soon reverse.
A third use for RSI is the levels of support and resistance. During uptrend, the stock will often stay above the 30th level and often reach 70 or higher. When the stock is in a downtrend, the RSI will usually stay below 70 and often reach 30 or lower.
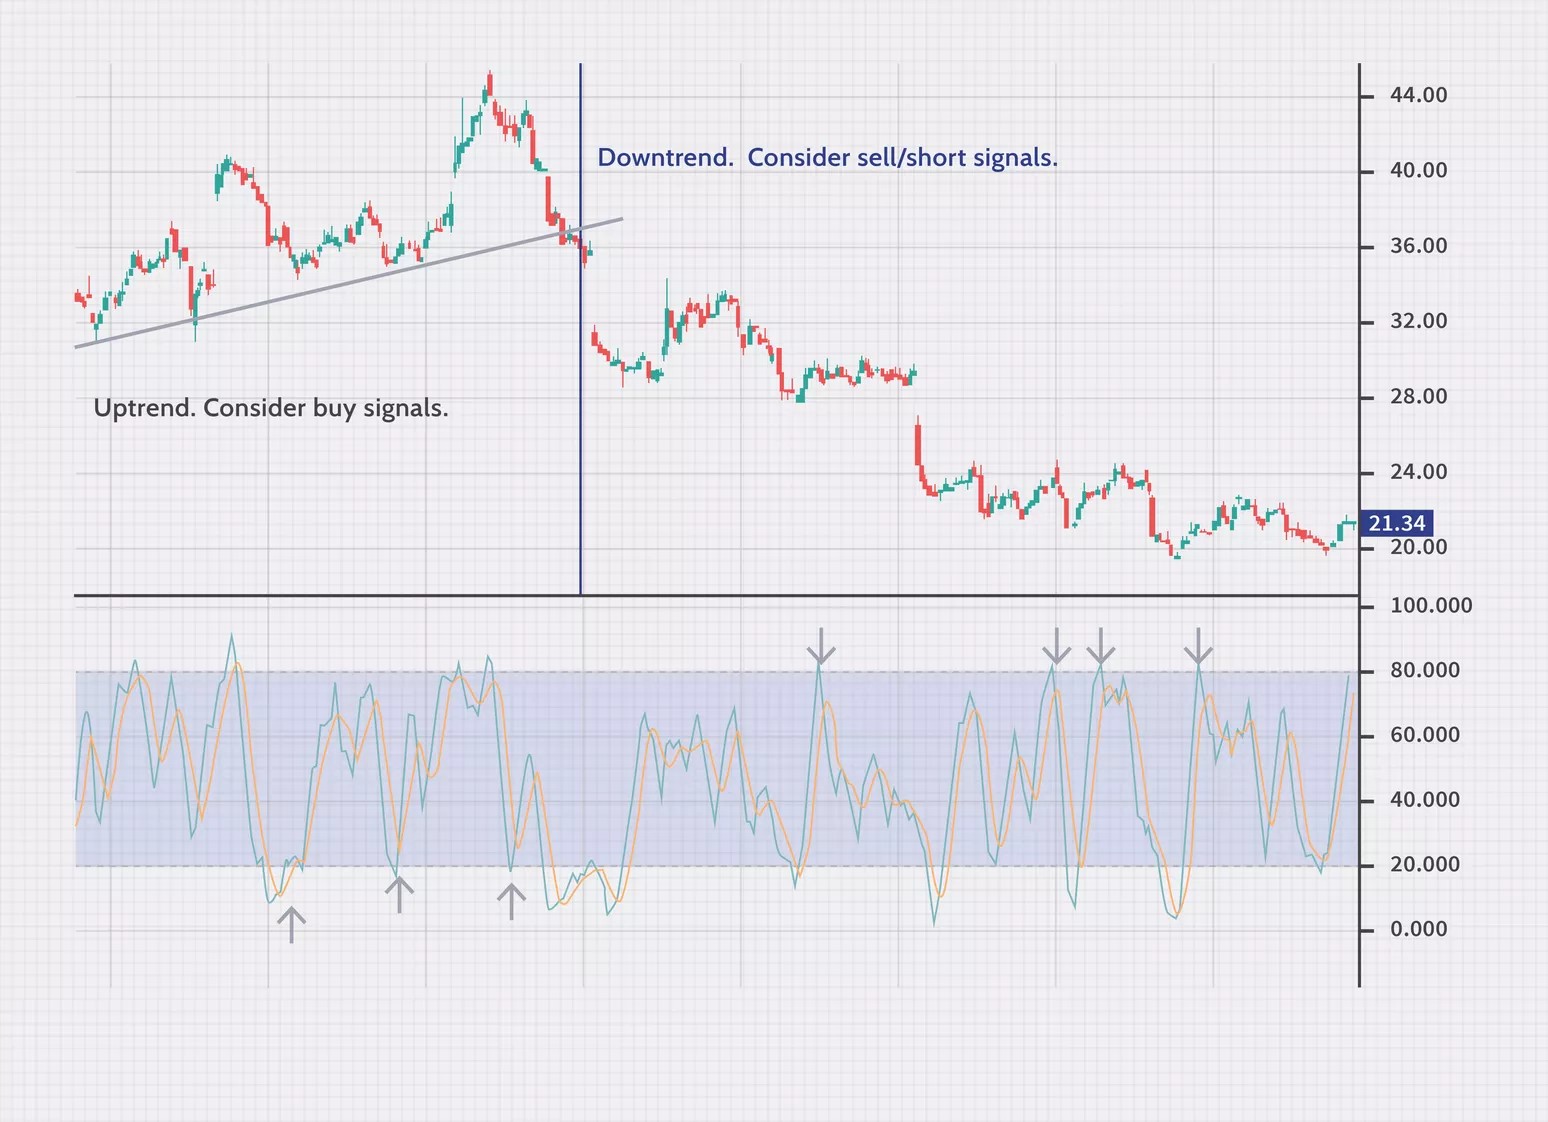
- Stochastic Oscillator
The stochastic oscillator is an indicator that measures the current price against the price range for several periods. Drawn between zero and 100, the idea is that when the trend rises, the price should make new peaks. With a downward trend, the price tends to make new bottoms. The stochastic shows whether this is happening, or not.
The stochastic is moving up and down relatively quickly, as it is rare for the price to make continuous peaks, keeping the stochastic close, 100 or continuous bottoms, keeping the stochastic close to zero. Therefore, the stochastic is often used as an indicator of overbought and resale. Values above 80 are considered overbought, while levels below 20 are considered resold.
Consider the general price trend when using overbought and resale levels. For example, during an uptrend, when the indicator falls below 20 and rises back above it, this is a possible buy signal. During an uptrend, rallies above 80 are less follow-up, as we expect to see the indicator move regularly to 80 and above . During a downtrend, look for the indicator to move above 80 and then fall back to signal a possible short trade. Level 20 is less significant in a downward trend.
The Bottom Line
The goal of any short-term trader is to determine the direction of inertia of an asset and try to profit from it. There are many technical indicators and oscillators, that have been developed for this specific purpose, and this slideshow has provided a few that you can start trying out. Use indicators to develop new strategies or consider including them in your current strategies. To determine which ones to use, try them in a demo account. Choose the ones you like best and leave the rest.
Disclaimer: The publications on this platform aim to provide useful information on financial topics. But they are NOT financial consultation or advice. Therefore they should not be used as a recommendation for making an investment decision on any type of financial products and services. We use in-depth research in the field but do not guarantee the completeness of the published materials. Always consult a specialist in your particular situation. "Applications In Life" Foundation is not responsible for any adverse consequences resulting from actions taken based on the information provided on the platform.