
This publication aims to help fulfil the mission of “Applications In Life” Fondation to support and develop accessible and understandable financial education by improving financial culture and forward-thinking mentality of the civil society.
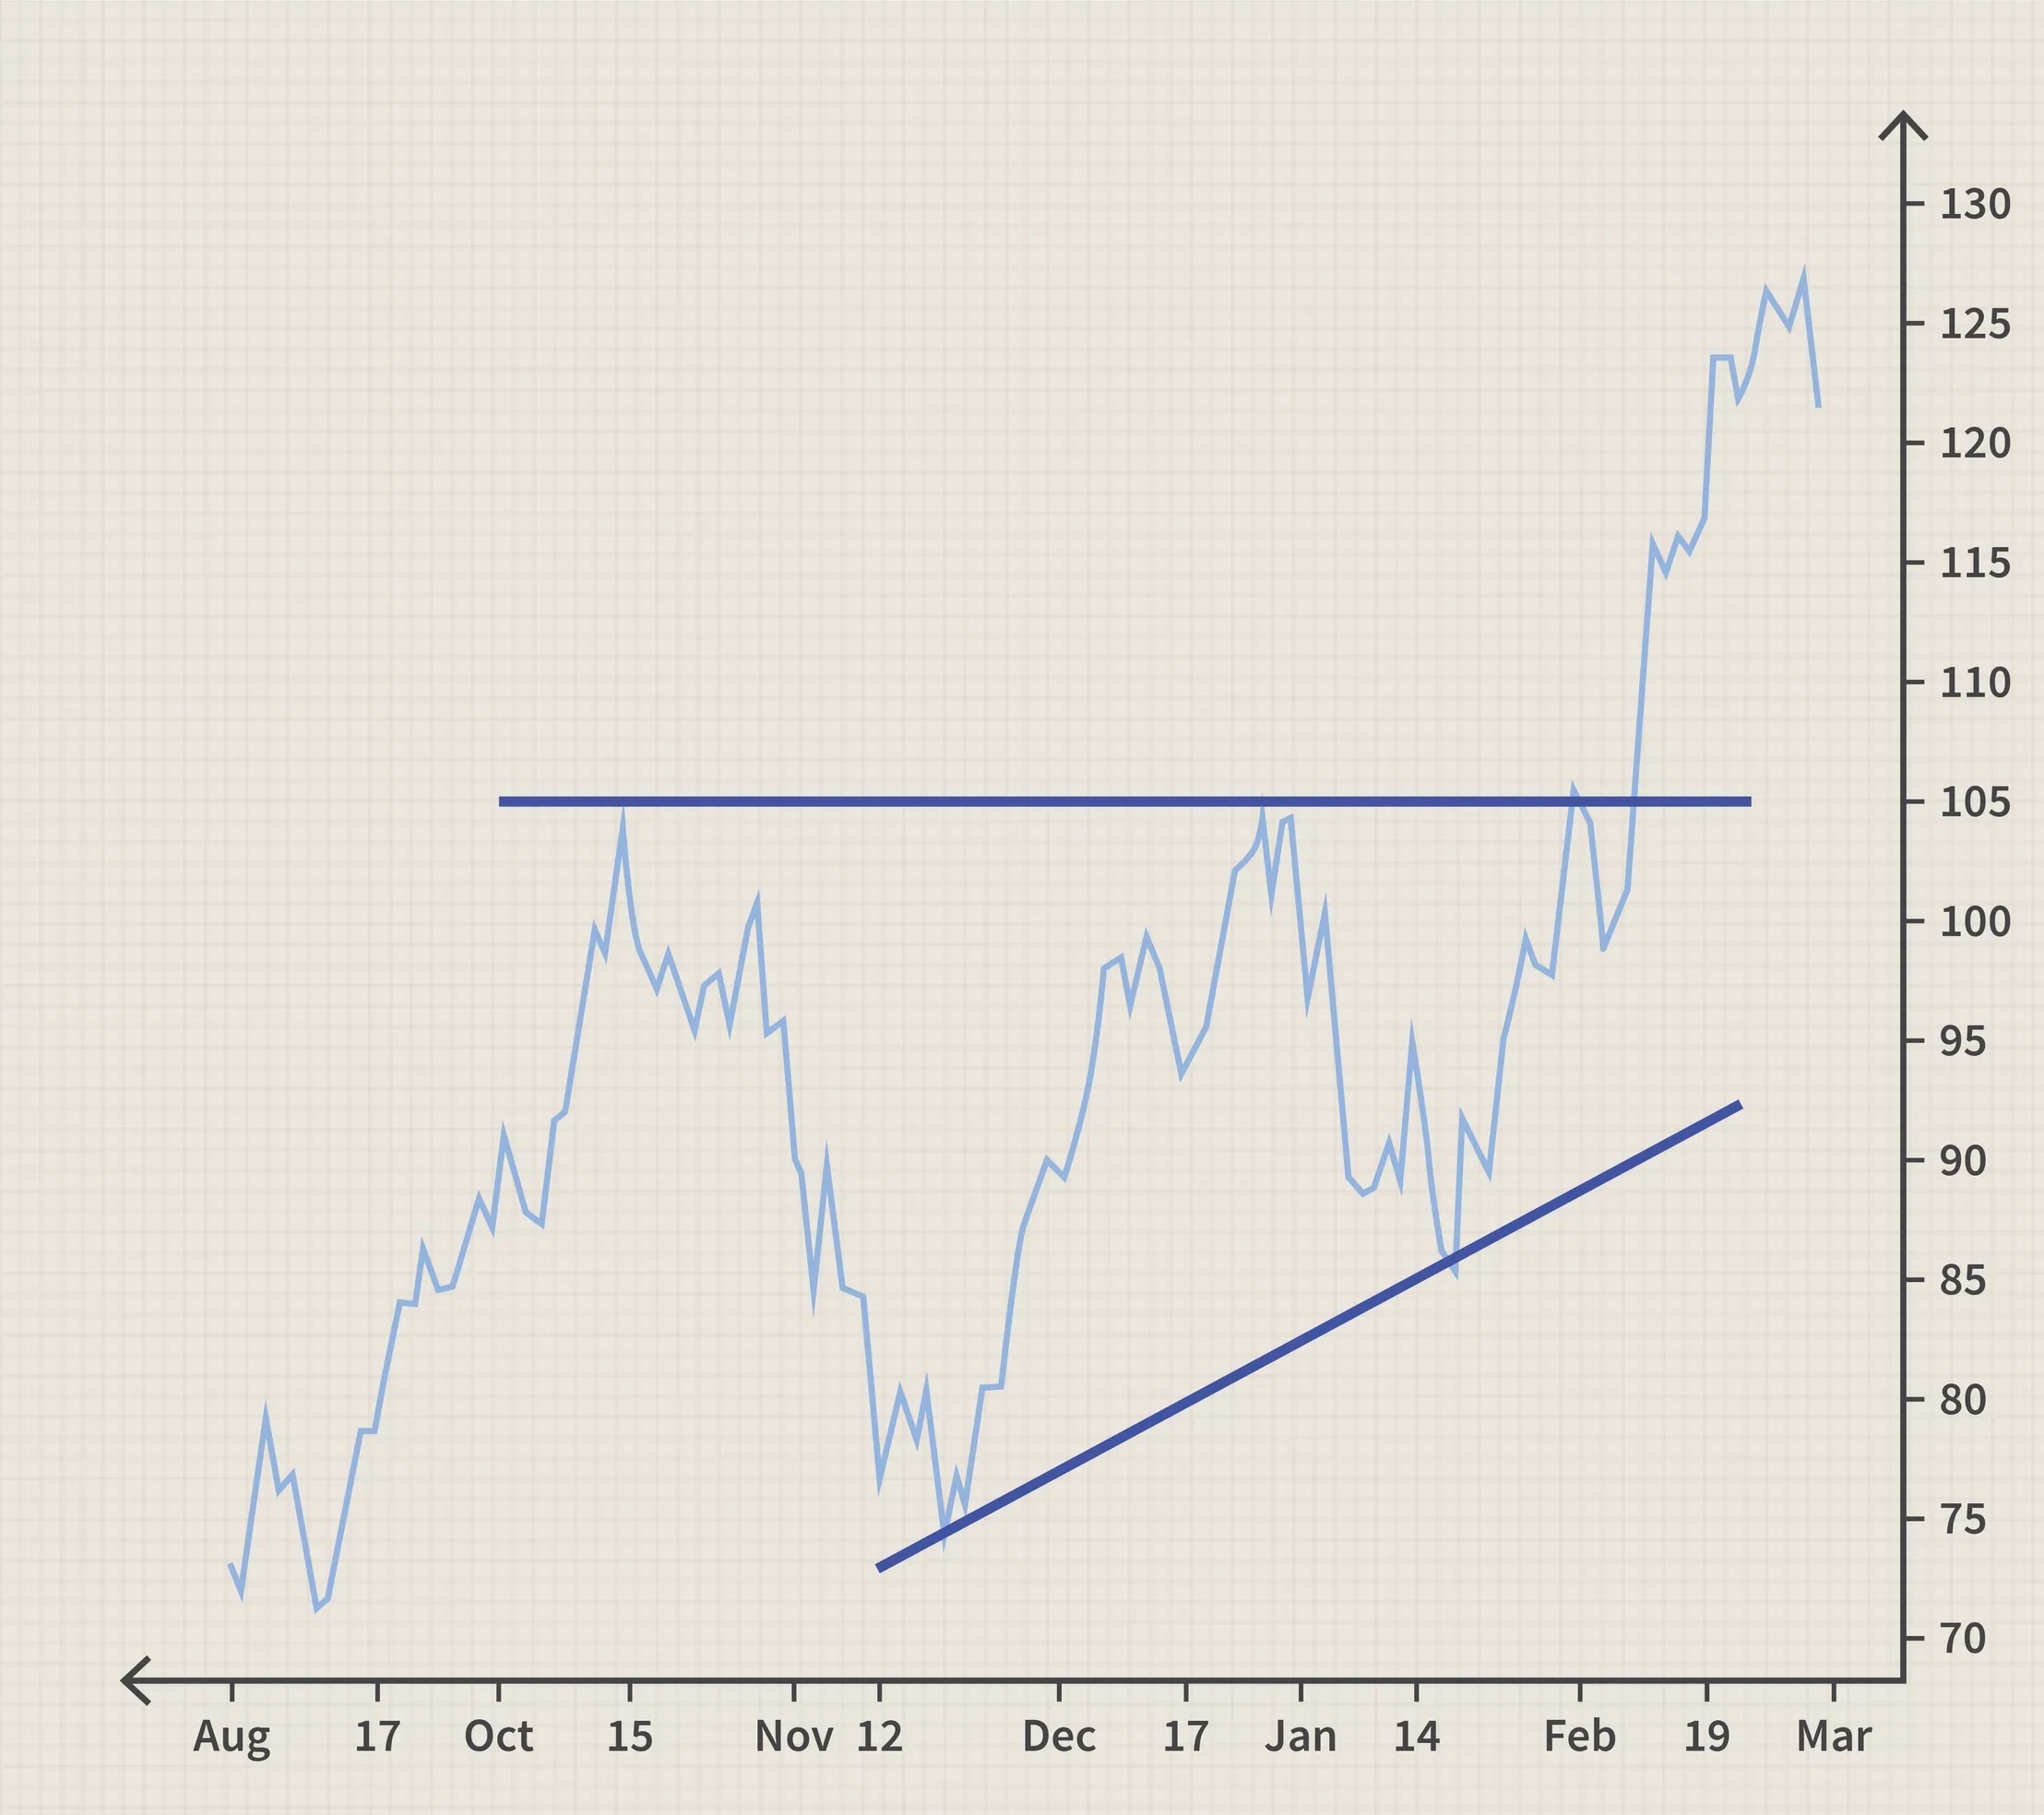
There are many technical tools that help determine important levels. Traders pull these levels through previous highs and lows, use Fibonacci retracements and pivot points, trend lines and more. Important levels are used for support / resistance for the price. The more times the price touches such a level, the more valid level you have managed to find.
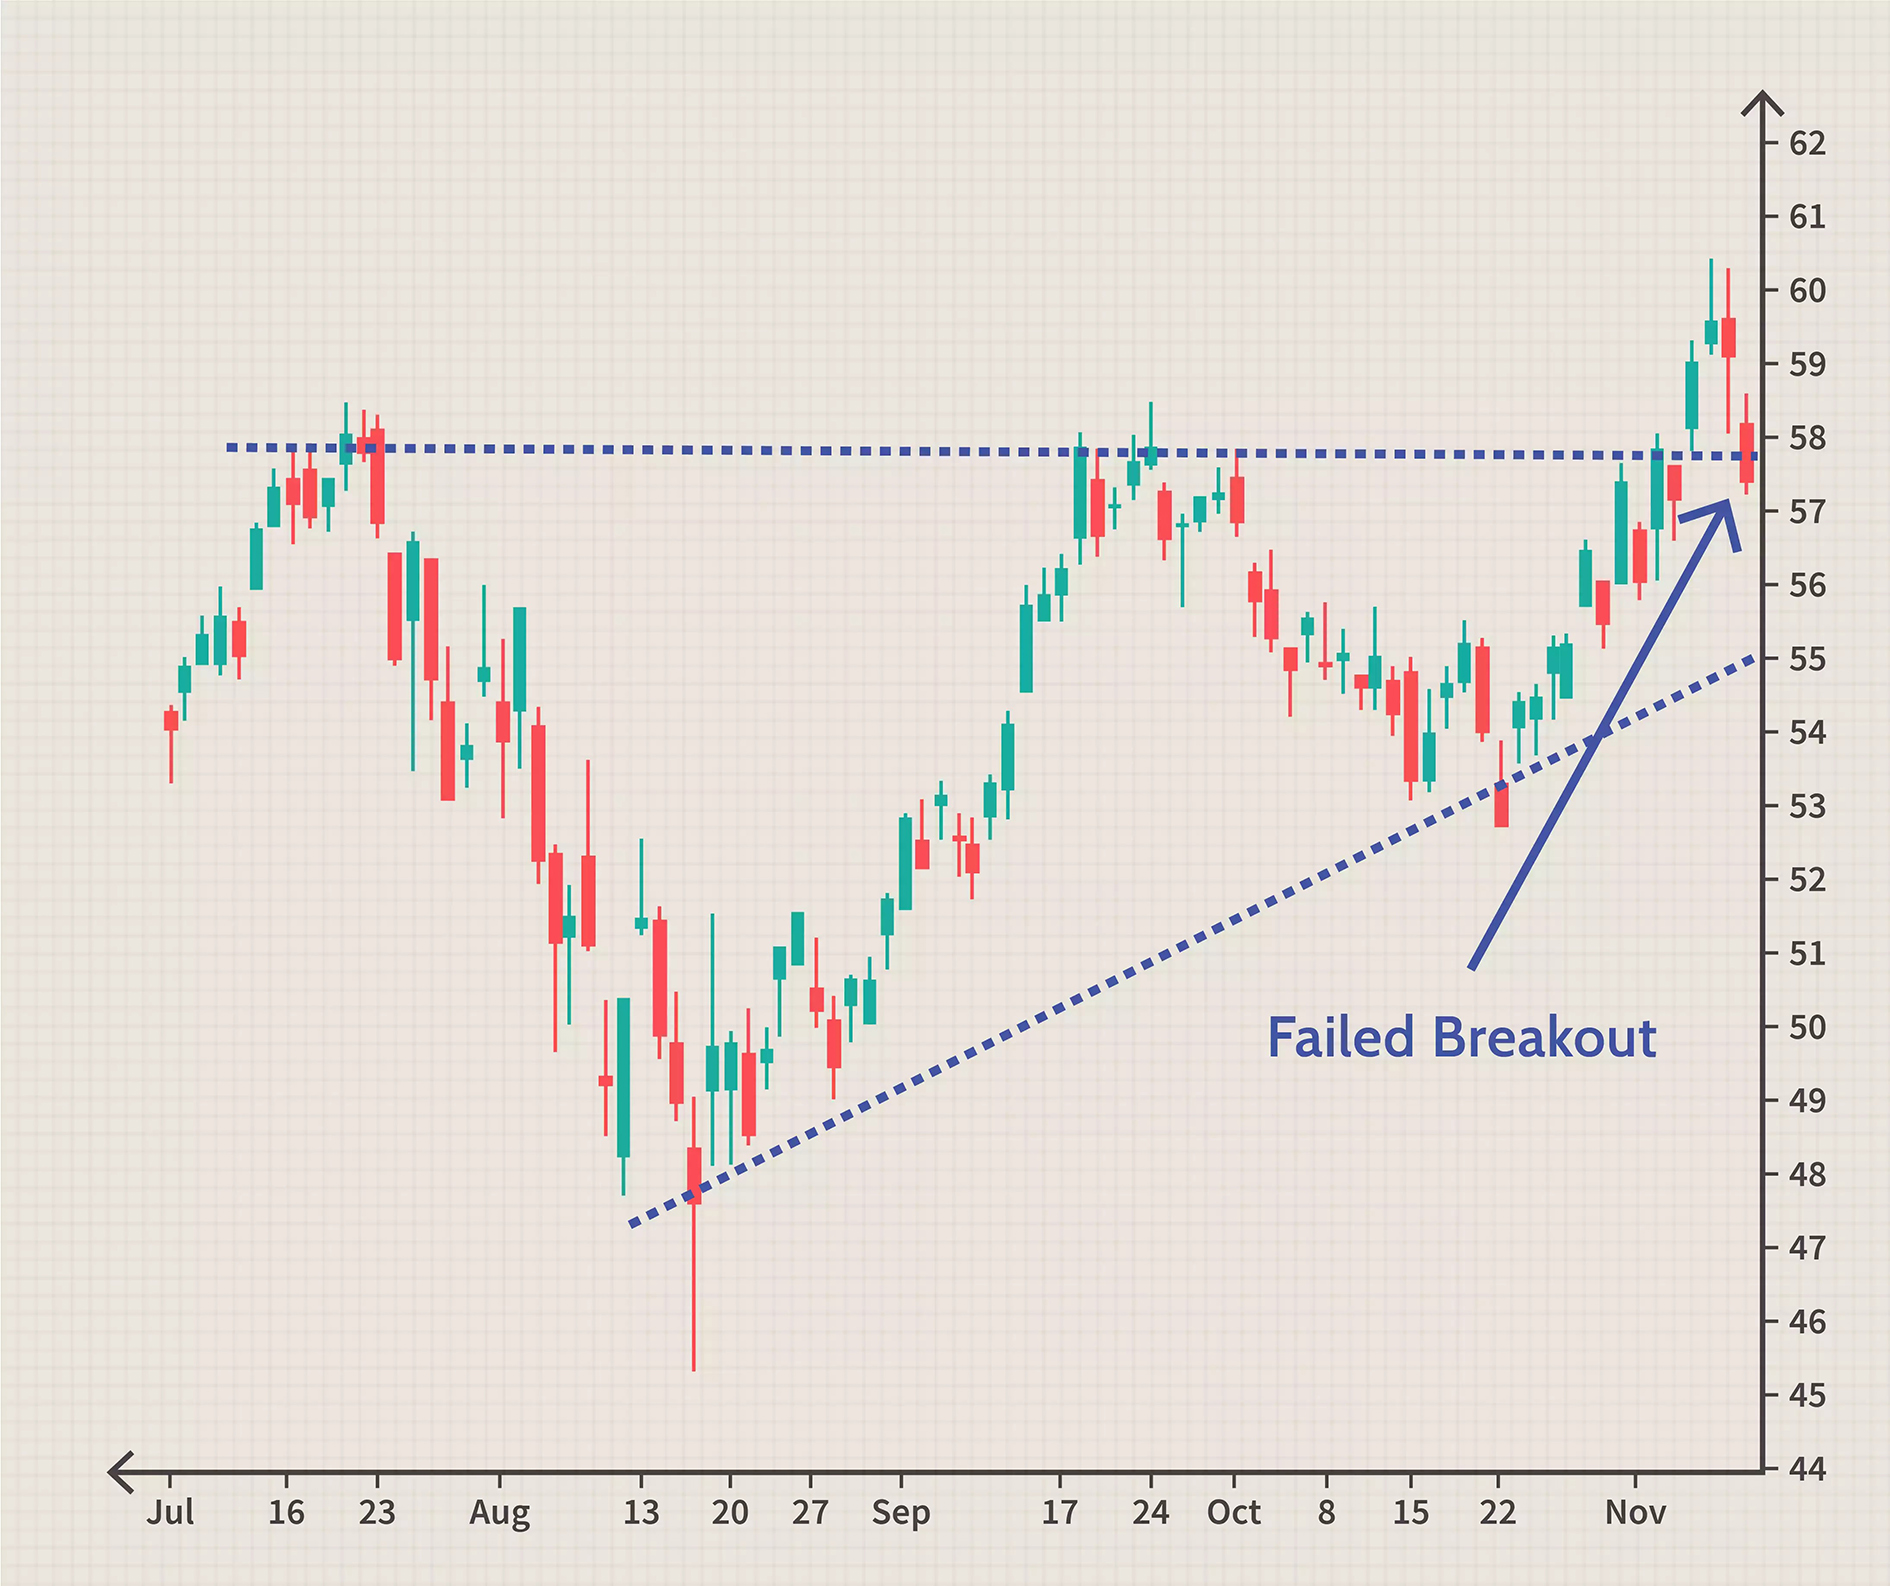
When the price breaks an important level, it means that it must continue to move in this direction. However, this will only happen in the event of a real breakthrough, and this does not happen every time. In many cases, the price exceeds an important level, but fails to maintain this movement. It returns to its previous trading range, so the breakout turns out to be fake.
Breakout trading is used by active investors to take a position in the early stages of a trend. Generally speaking, this kind of strategies can be the starting point for major price moves, expansions in volatility and, when managed properly, can offer low risk. Throughout this article, we’ll walk you through the basics of this type of trading and offer a few ideas to better manage this trading style.
What Is a breakout?
A breakout is a stock price that moves beyond a certain level of support or resistance with increased volume. The breakout trader enters a long position after the stock price breaks above the resistance or enters a short position after the stock breaks below the support. Once stocks are traded outside the price barrier, volatility tends to increase and prices usually move in a breakout direction. The reason for the breakout is such an important trading strategy, because these settings are a starting point for future increases in volatility, large price fluctuations and, in many cases, major price trends.
Breakouts occur in all types of market environments. Usually the most explosive price movements are the result of channel breaches and price model breaches, such as triangles, flags or head and shoulder models. Because volatility is negotiated over these time frames, it will usually expand once prices move beyond certain limits.
Regardless of the timeframes, breakout trading is a great strategy. Whether you use charts intraday, daily or weekly, the concepts are universal. You can use this strategy to swing trading, day trading or any style of trading, that you like to use.
How can we know true or false is the breakout?
As soon as the price goes through a level, it can be very difficult to tell. At the same time, it is obvious that the trader has to trade a different breakout and a false breakout in a different way.
Keep in mind that such pricing models as channels, triangles, and flags can be really valuable for identifying potential breakpoints. The more important the level, the harder it will be for the price to break it. At the same time, remember that a real breakout at such a level will have more far-reaching consequences.
Trade in fake breakouts
It is worth saying that there are more fake breaks than real ones. Novice traders tend to rush into breakout trading without real confirmation of a breakout, but are pushed out of the market by larger players.
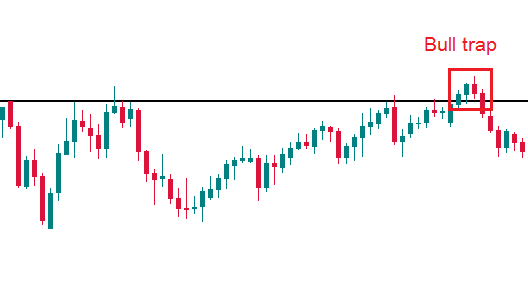
When, after a breakout attempt, the price returns to the previous trading range and is fixed there, it is a false breakout. This can happen immediately after the price breaks an important level or after up to 4 candles above the level. The latter is referred to as a bull / bear trap. Reverse models of candlesticks near the breakout level give reliable hints that the breakout was unsuccessful.
Fake breakouts are best traded in the direction of the trend. We strongly recommend that you analyze H1 and higher timeframes, as for shorter ones (M30, M15, etc.) the price action is too chaotic.
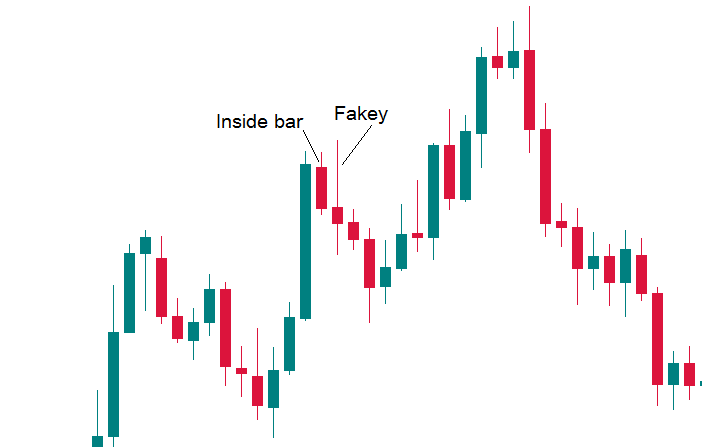
A specific case that should be mentioned is the so-called Fakey model or, in other words, a fake break of an inside bar. The inside bar is a candlestick that is completely covered by the previous candlestick. If you see an inside bar and then its break ends in a candle with a pin bar, this is a strong signal that the price will move in the opposite direction to the false break.
Trading a real breakout
If you have decided to enter the market in the direction of a breakout, do so cautiously. In many cases, simply placing a pending order, such as Sell Stop just below the support level, can trigger your login order and then result in a loss if the price comes back higher.
To solve this problem, some players place entry orders for a short position under the piercing candle. However, the risk of a false breakout remains high.
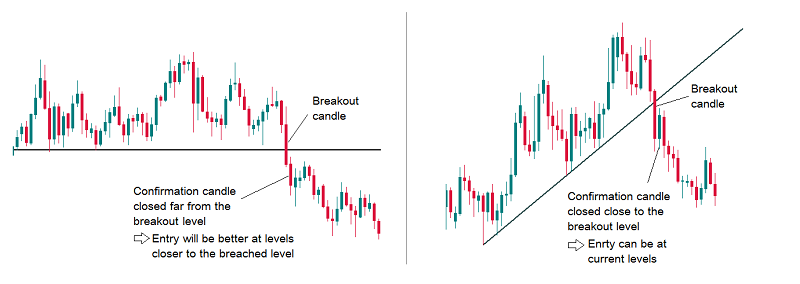
To increase your chances of success, you need to look at the piercing candle. Its length must exceed the average value at least 1.5 times. It must also have a whole body (it cannot be a doji or a pin). Even if the candle meets this description and closes below the support level, wait for the second candle – the confirmation candle. It must be smaller than the breakout candle and also close below the breakout level.
If the confirmation candle closes close to the breakout level, we can enter the market price. If the candle closes far from the breakout level, we place the Sell Limit closer to the breakout level.
Finding a good candidate
It is important to consider, when trading breakouts, the levels of support and resistance of the underlying stocks. The more valid these levels are, the more times a stock price has touched these areas and the more important they become. At the same time, the longer these levels of support and resistance are played, the better the result when the stock price finally breaks.
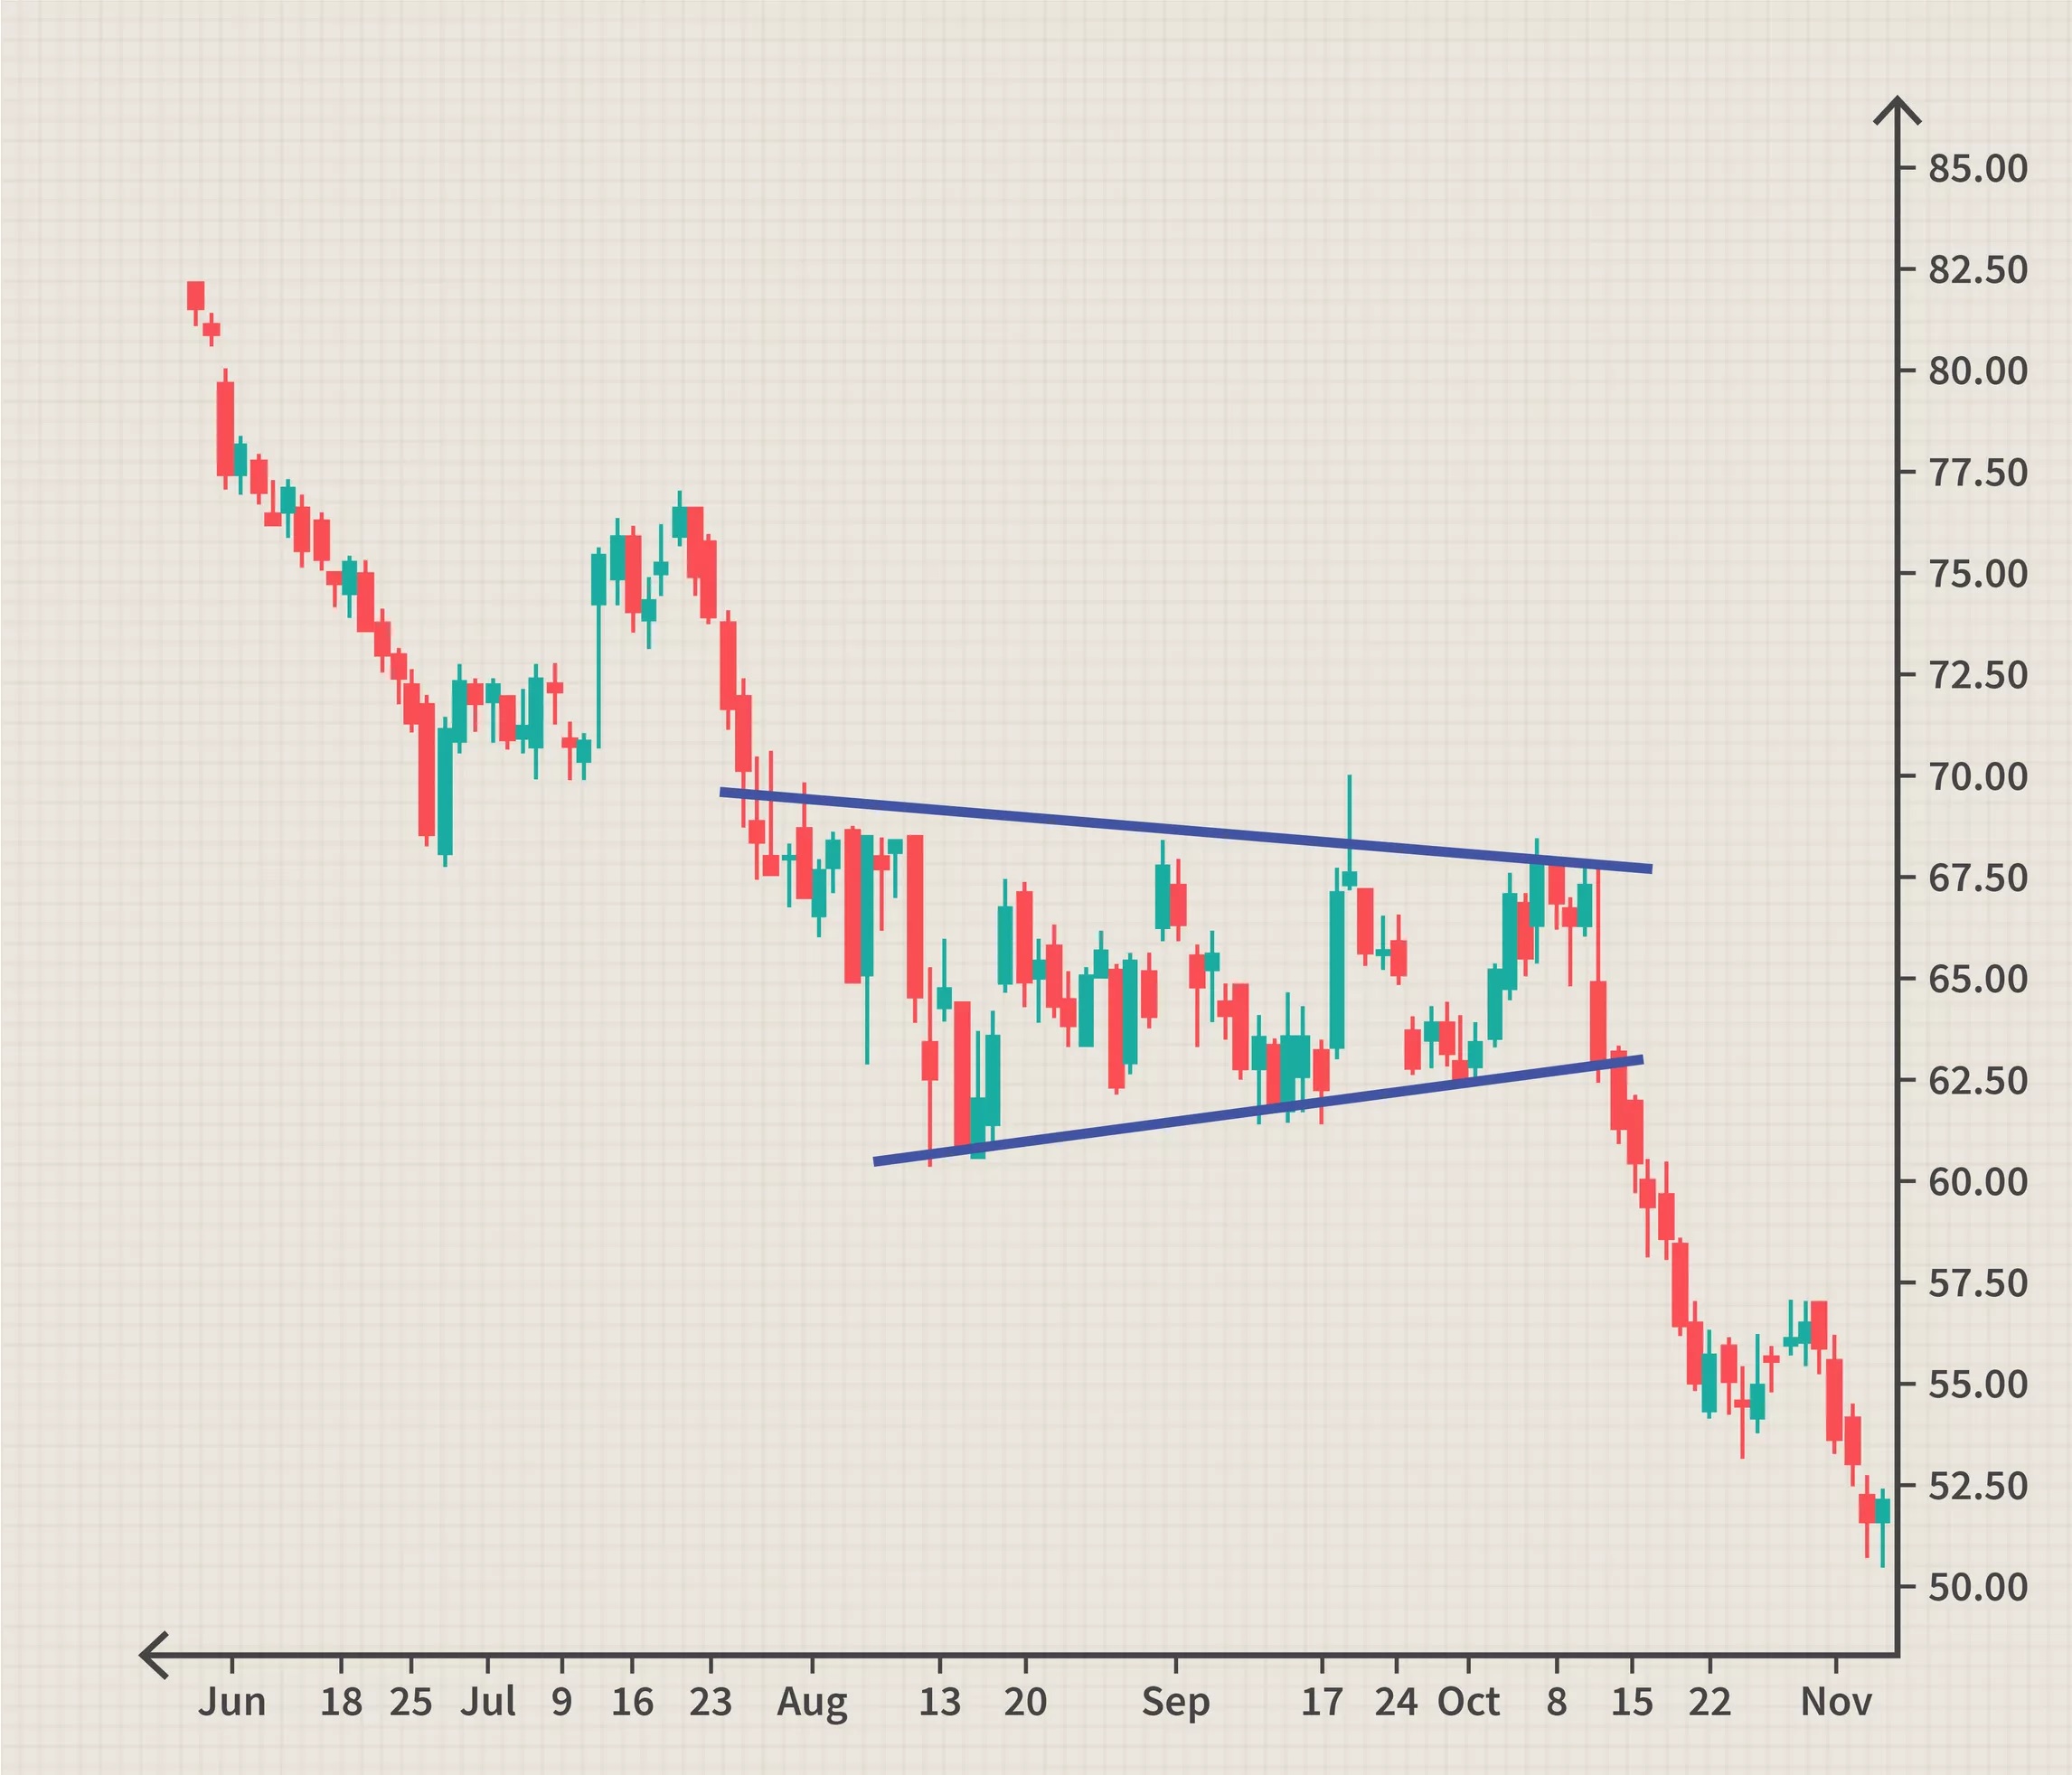
As prices consolidate, different price patterns will appear on the price chart. Entities such as channels, triangles and flags are valuable vehicles in search of stock for trading. In addition to patterns, the consistency and length of time a stock price adheres to support or resistance levels are important factors to consider when finding a good candidate.
Entry points
Once you find a good trading tool, it’s time to plan your trade. The easiest consideration is the entry point. The entry points are quite black and white when it comes to establishing positions in a breakout. Once prices close above the resistance level, the investor will establish an bullish position. When prices are set to close below the support level, the investor will take a bearish position.
Wait for confirmation to determine the difference between a breakout and a fakeout. For example, fakeouts occur when prices open beyond the level of support or resistance, but at the end of the day they move back within a previous trading range. If the trader acts too quickly or without confirmation, there is no guarantee that prices will continue into new trend. Many investors look above average for confirmation or wait until the end of the trading period to determine if prices will maintain the levels from which they have broken out of.
Planning exits
Predetermined exits are an essential ingredient for a successful trading approach. When breakouts are traded, there are three exit plans to arrange before a position is opened.
- Where to exit with a profit
When planning target prices, look at recent stock behavior to determine a reasonable target. When trading pricing models, it’s easy to use the recent price action to set a price target. For example, if the range of a recent channel or price model is six points, this amount should be used as a price target after stocks breaks out(see below).
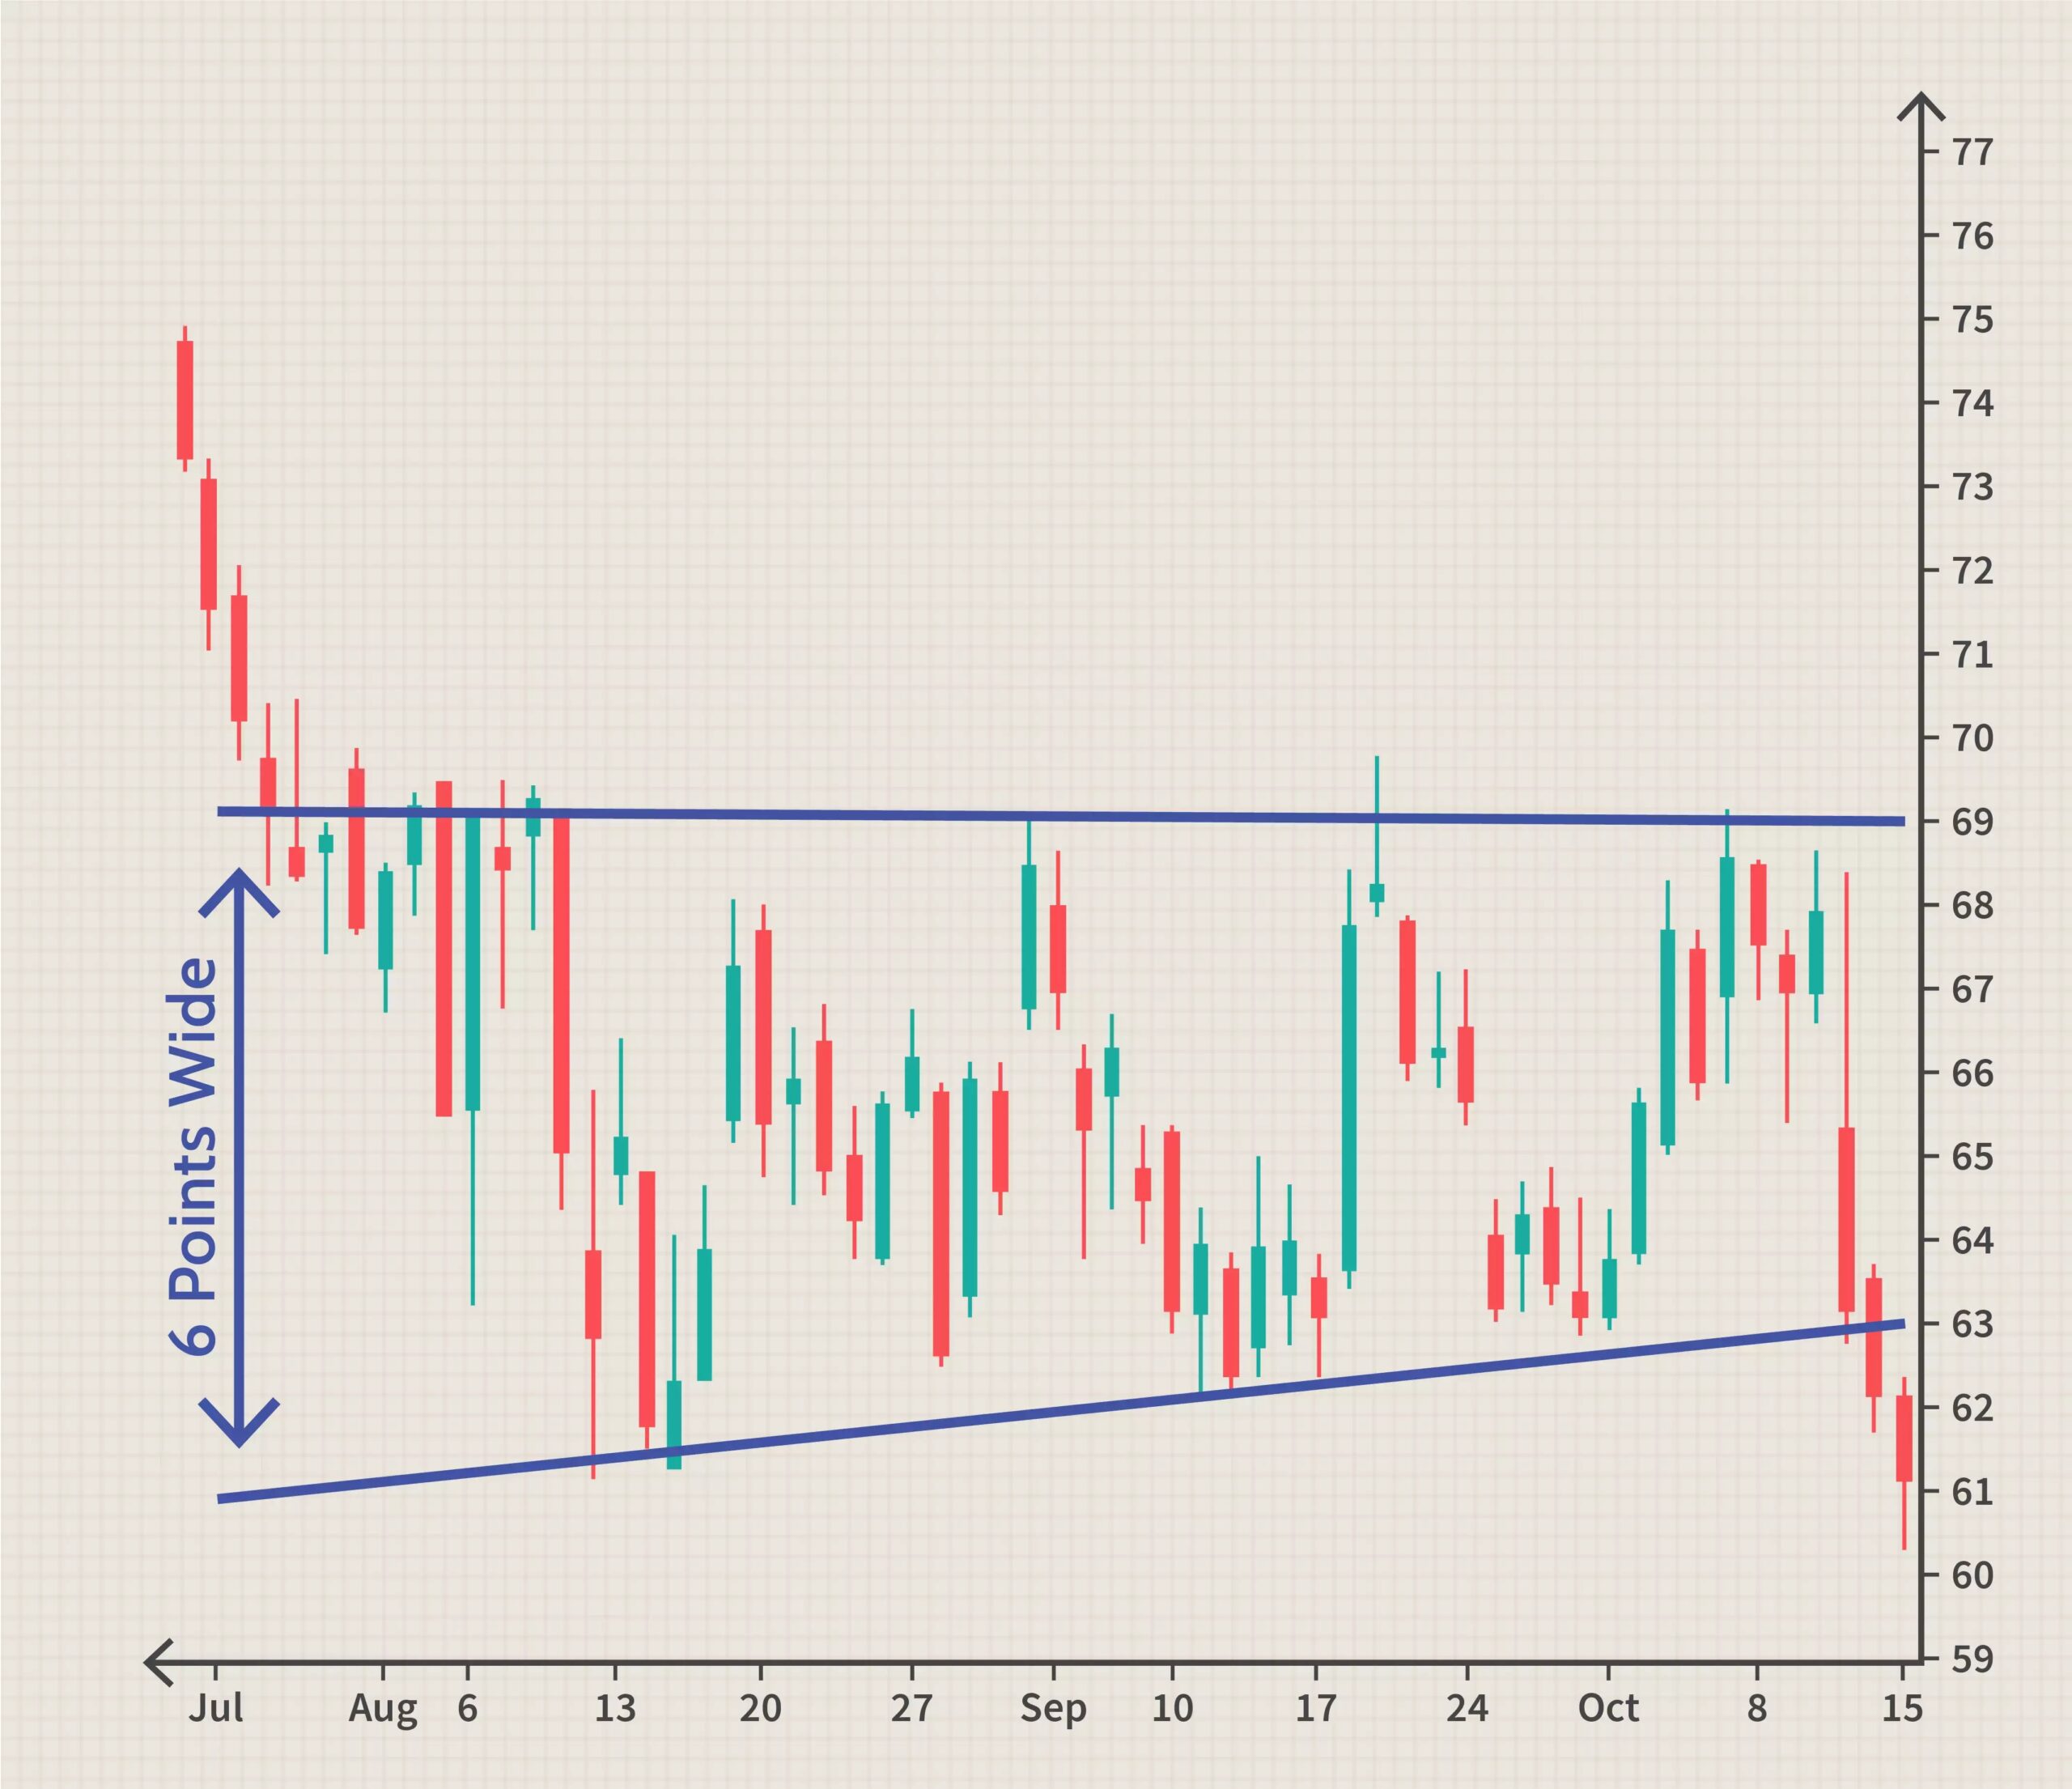
Another idea is to calculate recent price fluctuations and average them to obtain a relative price target. If the stock has made an average price fluctuation of four points during the last few price fluctuations, this would be a reasonable goal.
Here are some ideas on how to set price targets as a trading objective. This should be your trading goal. Once the goal is achieved, the investor can exit the position, exit part of the position to let the rest run, or issue a stop-loss order to lock in the profits.
- Where to exit with a loss
It is important to know when position has failed. Breakout trading offers this idea in a pretty clear way. After a breakout , the old resistance levels should act as new support, and the old support levels should act as new resistance. This is an important consideration, as it is an objective way to determine when a transaction has failed and an easy way to determine where to place your stop-loss order. Once a position is opened, use the old level of support or resistance as a line in the sand to close a lost trade. As an example, study the PCZ diagram below.
Once a trade fails, it is important to exit the trade quickly. Never waste too much room to a loss. If you are not careful, losses can accumulate.
- Where to Set a Stop Order
When considering where to exit a losing position, use the pre-support or resistance level above which prices have broken. Placing a stop conveniently within these parameters is a safe way to protect the position without exposing the trade to too much downside risk. Setting a stop higher than this is likely to cause an early exit, as it is common for prices to re-check the price levels from which they have just broken out of.
Looking at the chart above, you can see the initial price consolidation, breakout, re-testing and price target achieved. The process is quite mechanical. When considering where to place a stop-loss order, if it has been set above the old level of resistance, prices will not be able to test these levels again and the investor would be stopped prematurely. Setting a stop below this level allows prices to be tested again and to catch the trade quickly if it fails.
Summary
In summary, when trading breakouts, here are the steps to follow:
- Identify the candidate: Find stocks that have built strong levels of support or resistance and monitor them. Remember that the stronger the support or resistance, the better the result. Make sure you understand this when shopping for stocks.
- Wait for a breakout: Finding a good candidate does not mean that a deal should be taken prematurely. Patiently wait for the stock price to make its move. To make sure that the breakout persists, on the day the stock price trades outside the support or resistance level, wait until the end of the trading day to make your move.
- Set a reasonable goal: If you’re going to make a trade, set an expectation of where it’s going. If you don’t, you won’t know where to exit the trade. This can be done by calculating the average stock movement or measuring the distance between support and resistance (especially when trading price models).
- Let the stock test again: This is the most critical step. When the stock price breaks the resistance level, the old resistance becomes new support. When the action breaks the support level, the old support turns into a new resistance. In most of your trades, stocks will test the level they broke after the first few days. Prepare for it.
- Know when your trade / model fails: When a stock tries to test a previous level of support or resistance and it breaks back through it, this is where the pattern or break failed. It is mandatory to bear the loss at this time. Don’t bet on your losses.
- Initial trades to close the market: You cannot find out in the open whether prices will be kept at a certain level. Therefore, you may consider waiting close to the market close to get out of a losing trade. If the stock has remained outside a predetermined level of support or resistance to market closing, it is time to close the position and move on to the next.
- Be patient: This strategy requires a lot of patience. By following these steps, you will reduce your emotions and be more objective about the positions.
- Exit on your goal: If you do not leave the trade at a loss, then you are in a trade. You need to stay in the trade until the stock price reaches its target or you do not reach your target for the time without reaching your target price.
The bottom line
Breakout trade welcomes volatility. Volatility experienced after a breakout is likely to evoke emotion because prices are moving fast. Using the steps outlined in this article will help you define a trading plan that, if properly implemented, can offer high returns and manageable risk.
Patience is often the best option. In chart diagrams such as Head and Shoulders, there is often a repeated test for a broken level.
If you decide to trade on a breakout, it means that you take a greater risk than otherwise. This higher risk should be reflected in your risk management: it is advisable to move the Stop Loss order to the break-even level quickly (ie move the Stop Loss to a point where your trade will close with 0 losses more faster than during range and trend trading). The risk / return ratio can be up to 1: 4, 1: 5. You can use scaling (partially close the position while the price moves in your favor).
Disclaimer: The publications on this platform aim to provide useful information on financial topics. But they are NOT financial consultation or advice. Therefore they should not be used as a recommendation for making an investment decision on any type of financial products and services. We use in-depth research in the field but do not guarantee the completeness of the published materials. Always consult a specialist in your particular situation. "Applications In Life" Foundation is not responsible for any adverse consequences resulting from actions taken based on the information provided on the platform.