
This publication aims to help fulfil the mission of “Applications In Life” Fondation to support and develop accessible and understandable financial education by improving financial culture and forward-thinking mentality of the civil society.
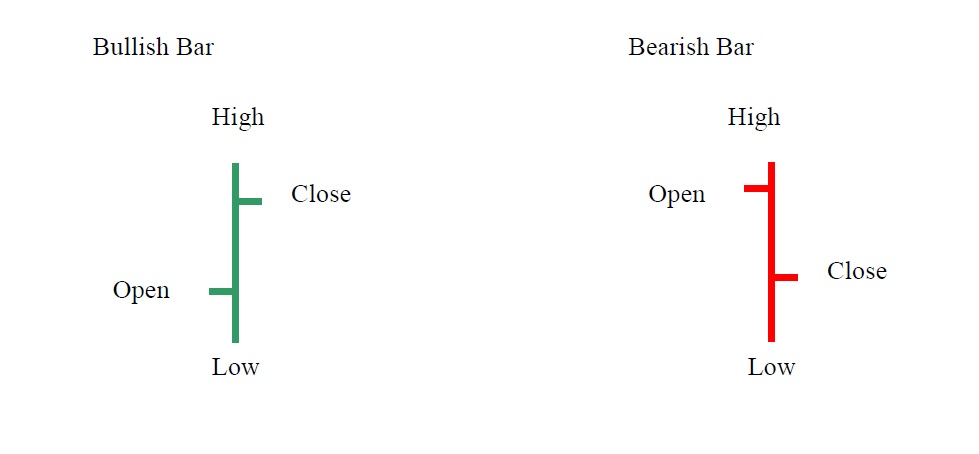
Japanese candlesticks offer a better visual perspective for predicting future market activities than bars. Intraday charts with clear Japanese candle patterns are invaluable for entry and exit strategies. Below is a comparison between a bar chart and a candlestick chart
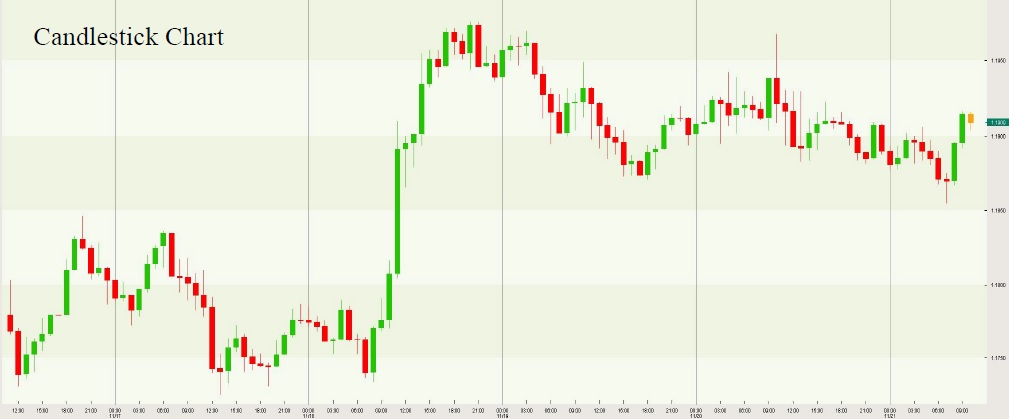
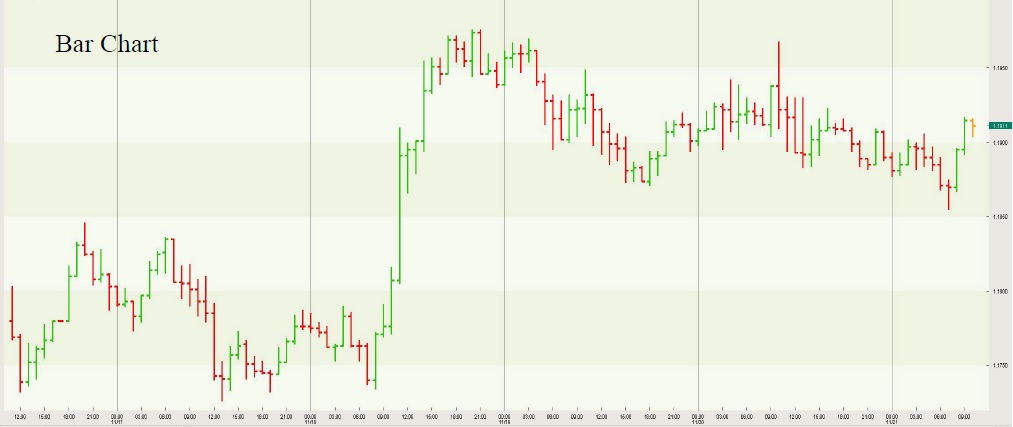
Comparison between Candlesticks and Bars
Candlestick models are reliable in all time frames. Some patterns, such as morning stars, evening stars, and haramids, are rarely seen in intra-day trade, as they require a gap between the closing of one candle and the opening of the other. In electronic currency trading and the movement of liquid prices, gaps between candlesticks rarely occur during the day. Gaps are found when the OPEN of the next candle does not equal the CLOSED of the previous candle.
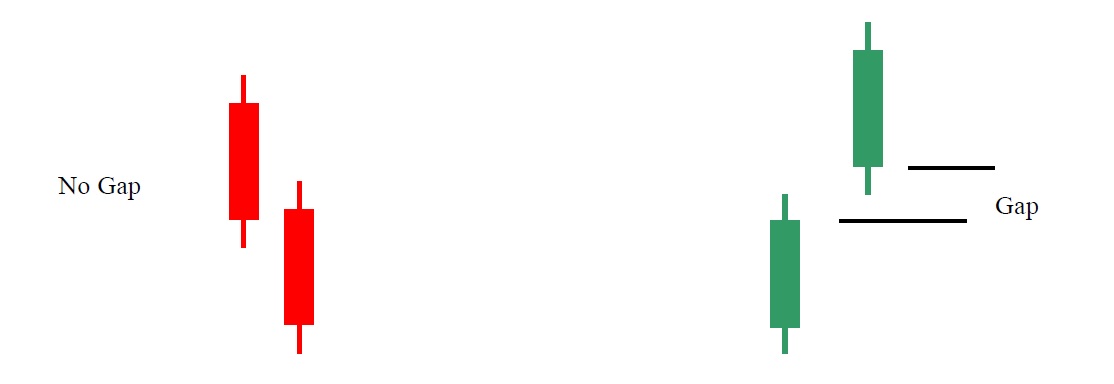
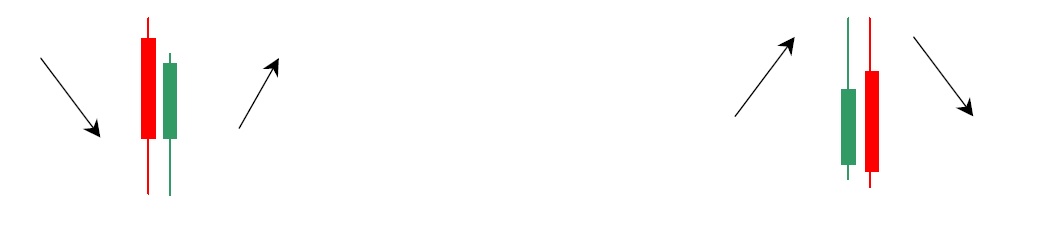
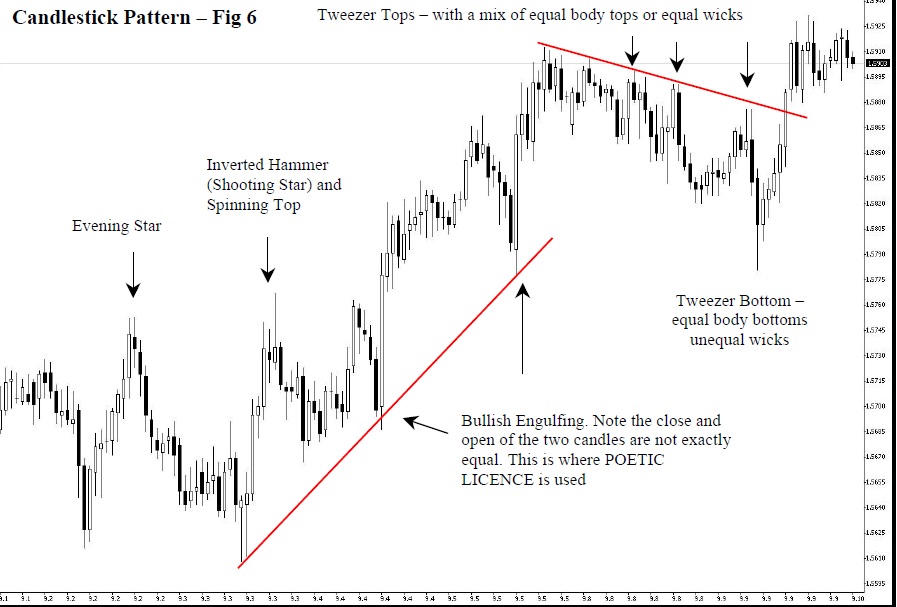
However, we can use morning stars and evening stars without the gaps. Here we use a “poetic license” (where POETIC LICENSE is a justifiable departure from conventional form rules). The examples we will show in the next section depict perfect candlestick patches, but in reality we don’t always get perfect pats there. For example, we define the following models as the same.
The deviation from the ideal formation is often caused by sudden price movements as the chart is updated from one time period to the next. Ideally, the closure of the previous candle should align exactly with that of the next candle. Using candlestick alerts creates huge benefits for profit because it allows a trader to make a quick decision. Combined with chart models and appropriate indicators, we have found that candle models provide reliable entry and exit points.
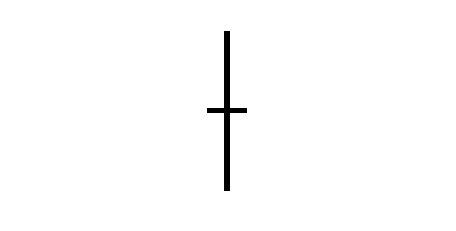
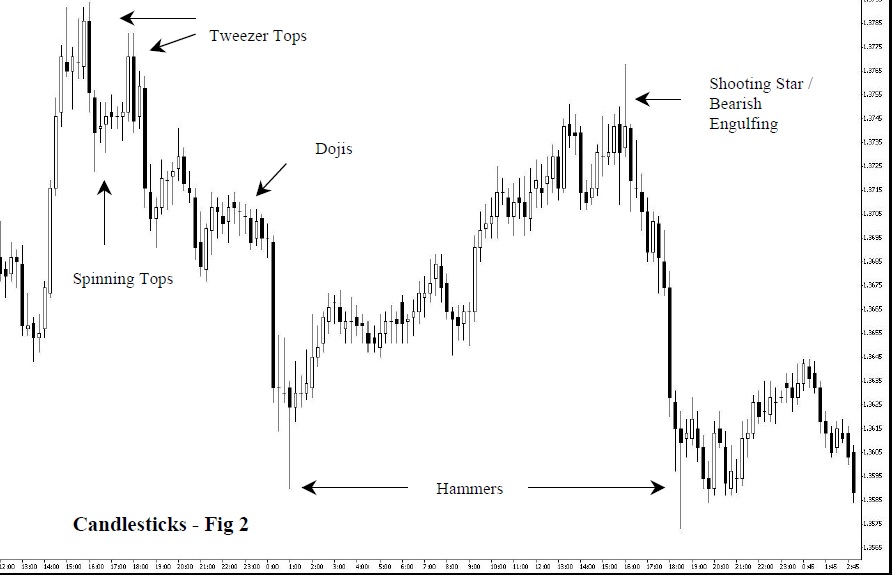
Doji
Doji is a reversal signal. Opening and closing prices are at one price or another. The lack of a true body means that bulls and bears fight and the balance of power can shift. Doji is a warning sign of an impending turn. Continue with caution. A doji needs a candle for confirmation before acting on it, and when found in other candle patches, the doji candle adds strength and reliability to the formation. If there is a doji in an uptrend, we need a close one below the close of the doji to confirm that the trend has changed.
Dragonfly Doji (Bullish)
This doji is sometimes seen at the bottom of a move. The open and close prices are the same. The Long wick (shadow) below indicates a reversal. This patten is more bullish than a hammer.
Gravestone Doji (Bearish)
The gravestone doji is often seen at tops. The open and close prices are the same. There is a tall wick (shadow). This pattern is more bearish than a shooting star. Technically, it should not have a body.
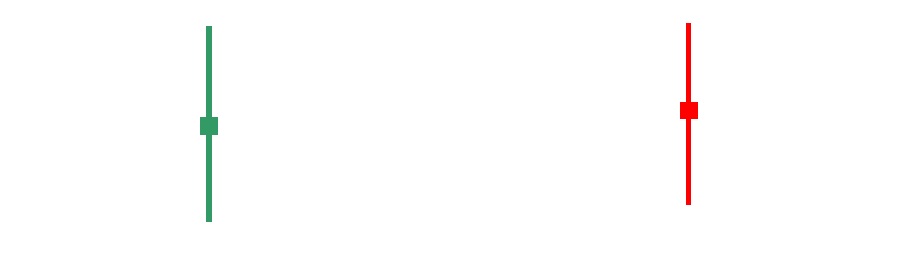
Spinning Top
The spinning top can be a very good reversal signal and can be any color. The smaller the real body, the smaller the direction of the market.
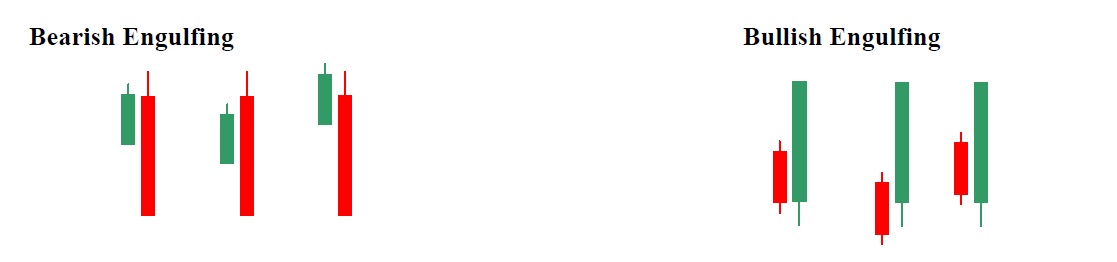
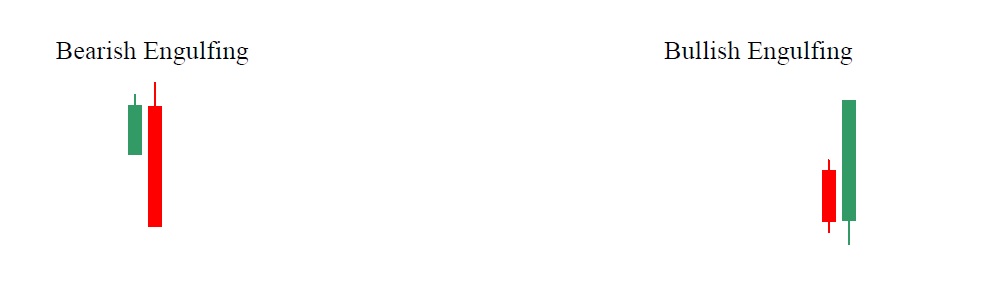
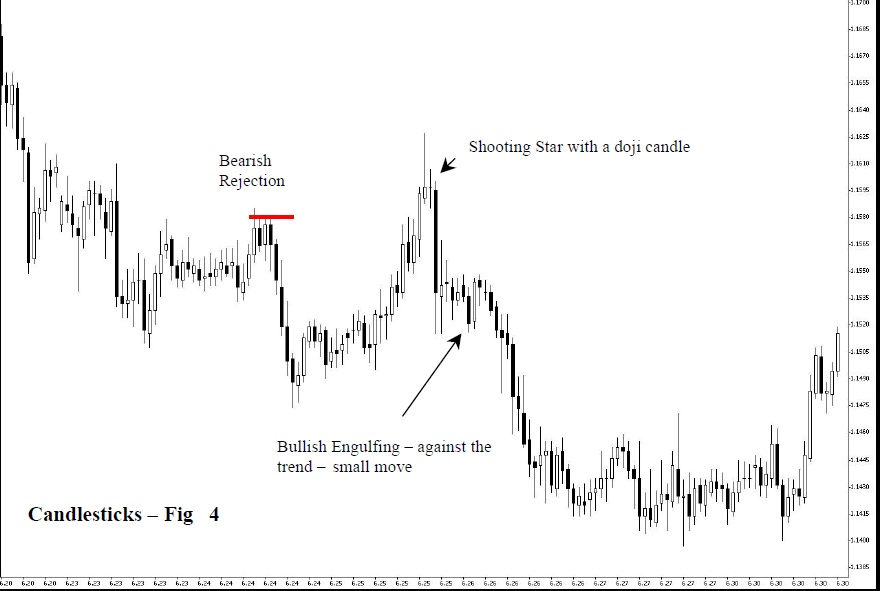
Bullish Engulfing Pattern
The market must be in a clearly definable downtrend, not in sideways consolidation. The first candle is the colour of the short term trend (down) or a doji. The colour of the reversal (up) is the second candle. The second candle body engulfs the previous body. Ignore the wicks (shadows). An even stronger signal occurs when a candle body engulfs the bodies of 2 or 3 previous candles.
Bearish Engulfing pattern
The market should be in a clearly identifiable trend. The first candle is the color of the short-term trend (upward) or doji. The second candle is the reverse color (down). The second candle body surrounds the previous candle body. Ignore the wicks (shadows). The size of the wrapped candle body does not matter. A stronger signal is obtained when 2 or more candle bodies are covered by a single candle body.
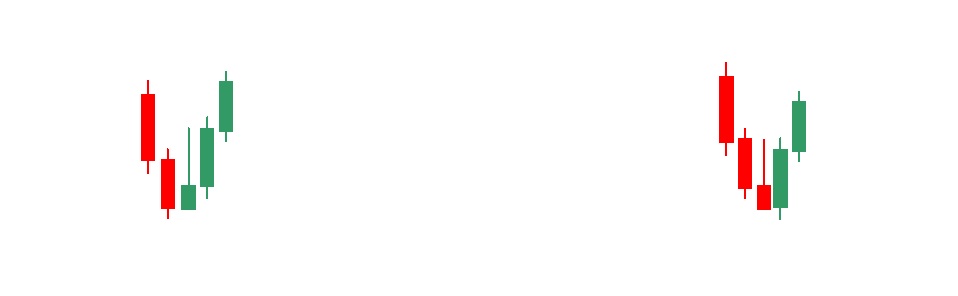
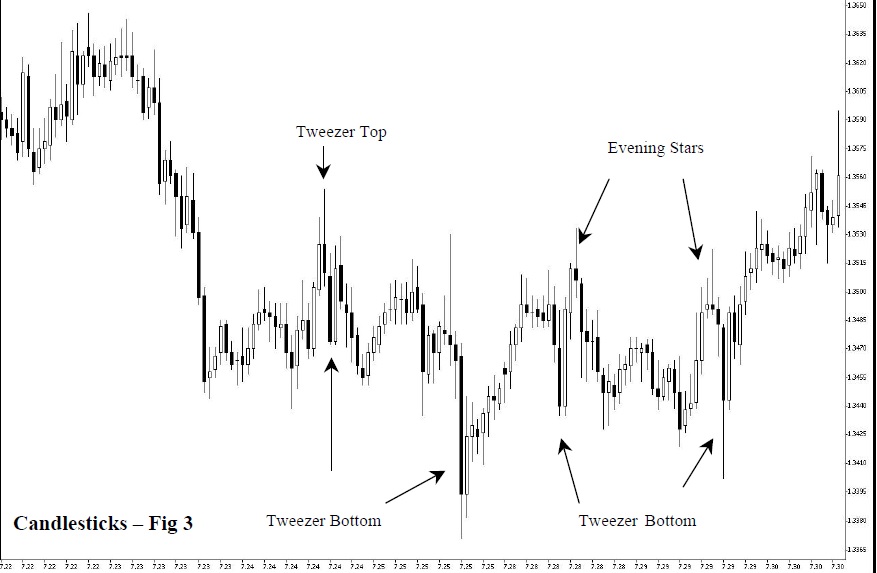
Tweezer Bottom
Two or more candlesticks with matching bottoms. They can be composed of real bodies, wicks (shadows) and/or dojis.
Tweezer Top
Two or more candlesticks with matching tops. They can be composed of real bodies, wicks (shadows) and/or dojis. These occur on consecutive or nearby candles.
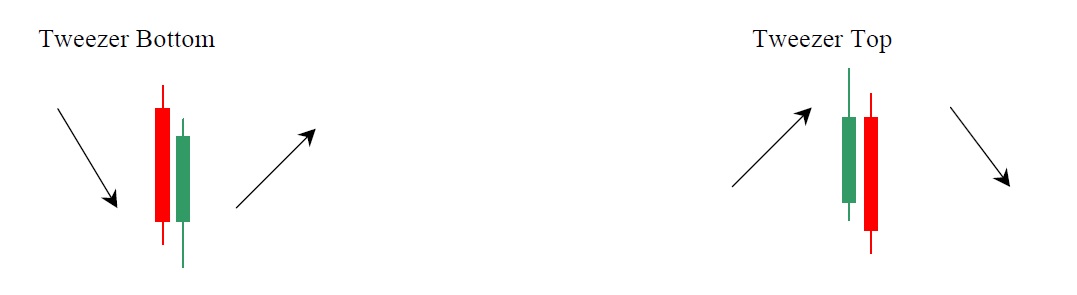
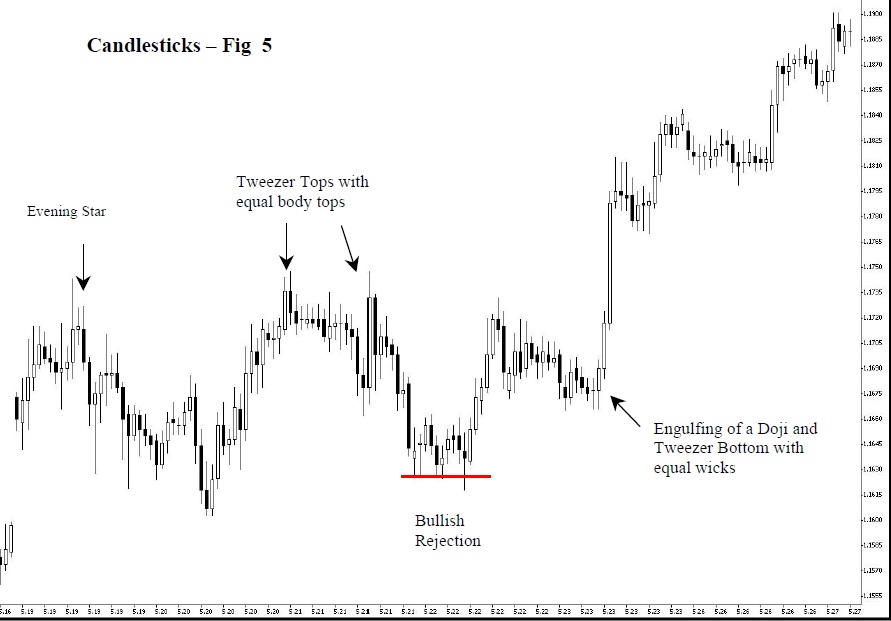
Tweezer Top and Bottom candlestick patterns are good reversal signals. The wicks or bodies must be at the same level. Look for the 2 types of tweezer bottonms and 2 types of tweezer tops.
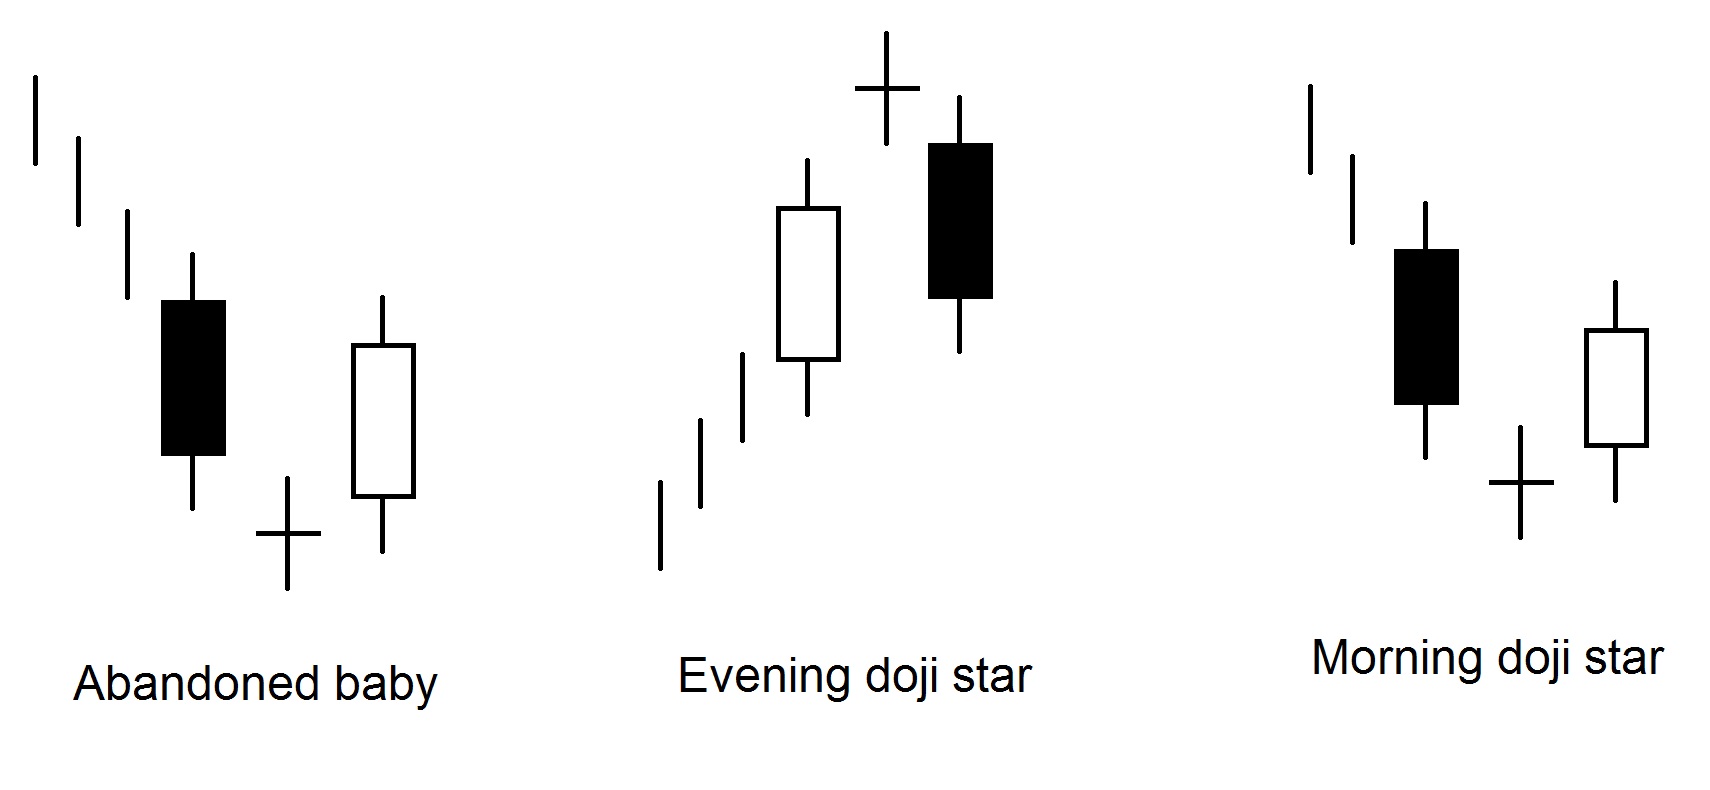
Morning Star Bullish reversal sign
The star is a three-candle patty. The first candle is a tall red true candle, the second is a small true candle (red or green) that pops under the first true candle, and the third is a tall green candle that closes at least 50% in the red candle. However, if there is no gap, as candles do not often go off during the forex day, still count it as a morning star.
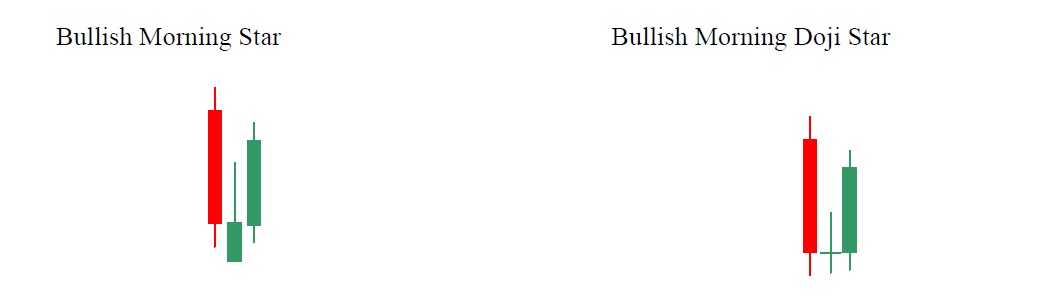
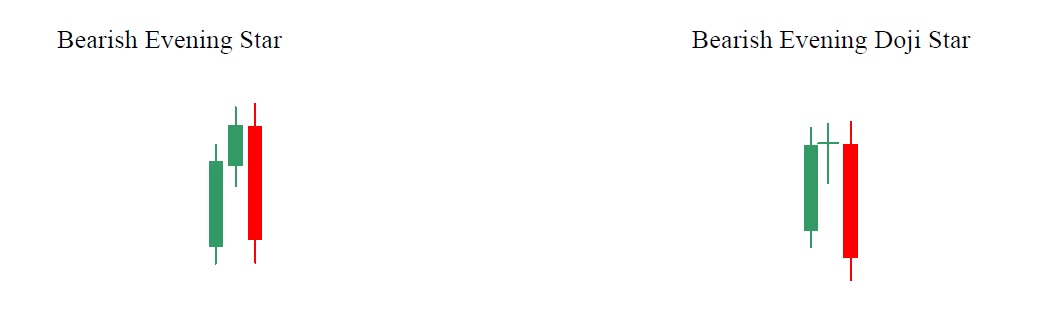
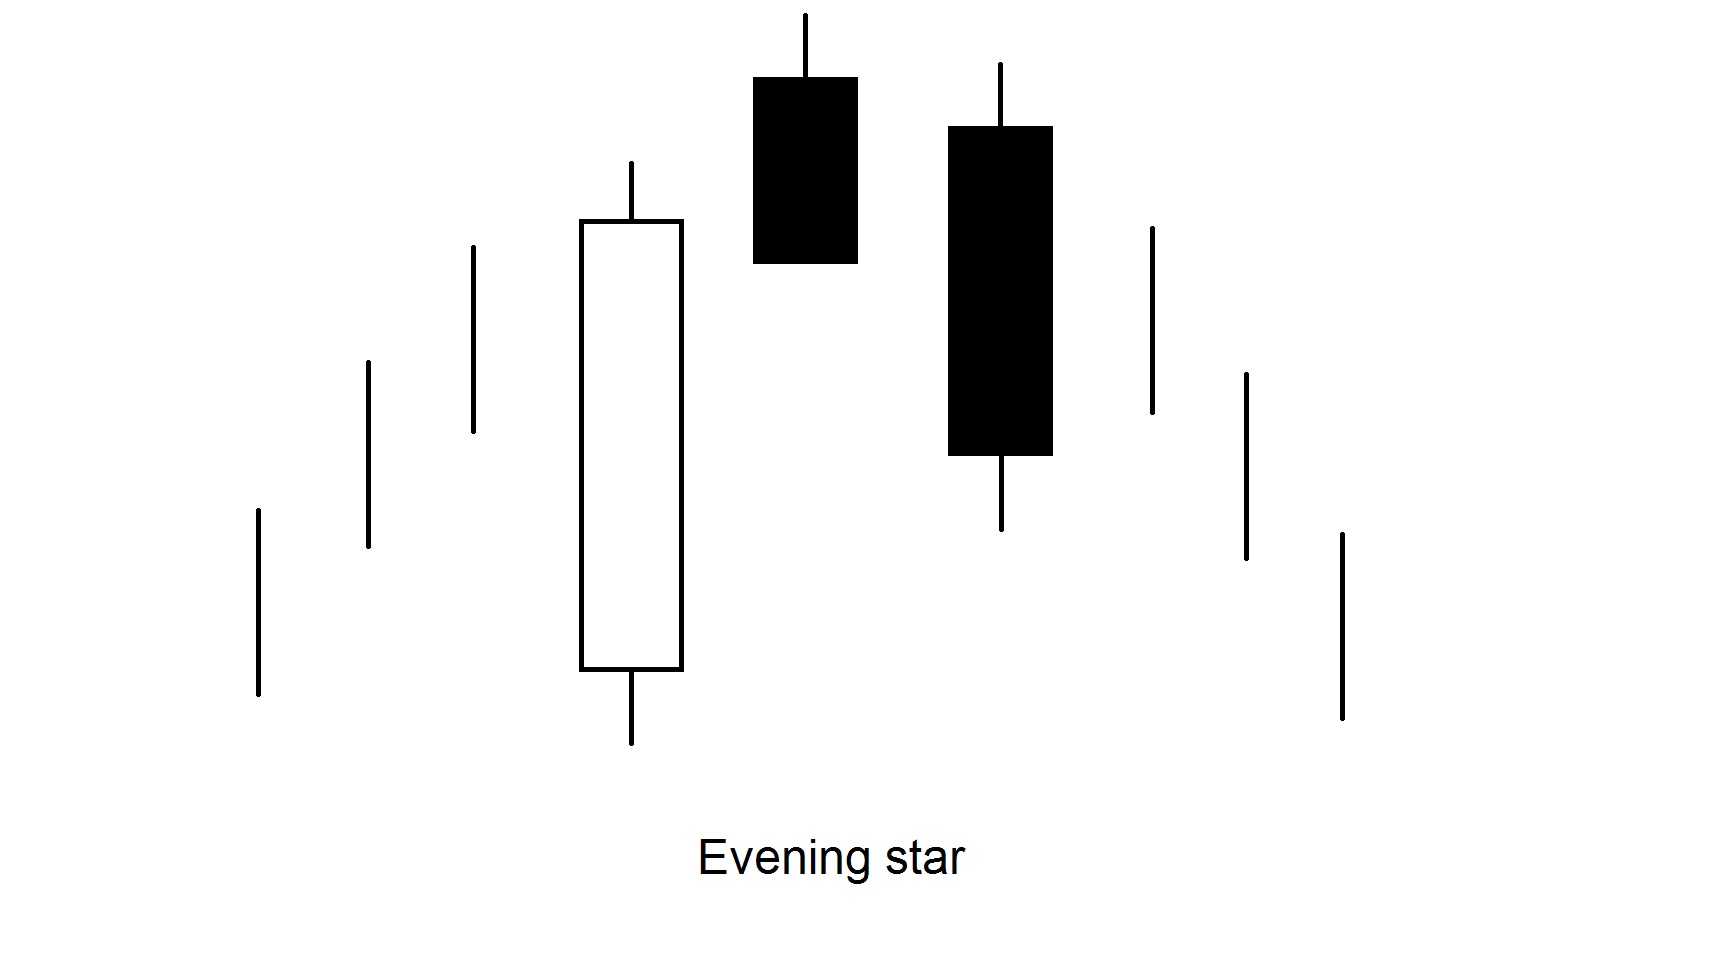
Evening Star Bearish Reversal signal
Three candle models in ascending price range The first candle is a tall green true body. The second is a small true body (red or green) that diverges over the previous true body, and the third is a tall red candle that closes at least 50% in the true body of the first candle.
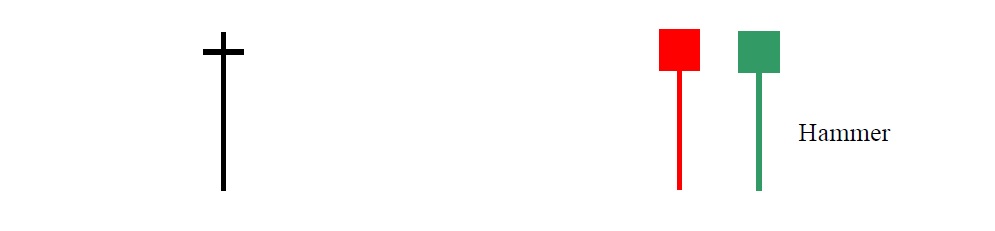
Hammer Bullish after a significant downturn
A reversal signal. The long lower shadow should be at least twice the length of the true body. The real body can be any color. The hammer needs a confirmation candle before we can act on it. We need to see a loved one above a loved one.
Inverted Hammer Bullish at bottom of trend
Wait for a bullish verification candle before acting
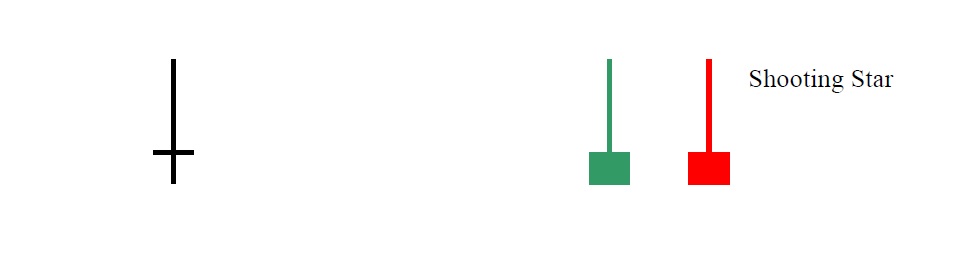
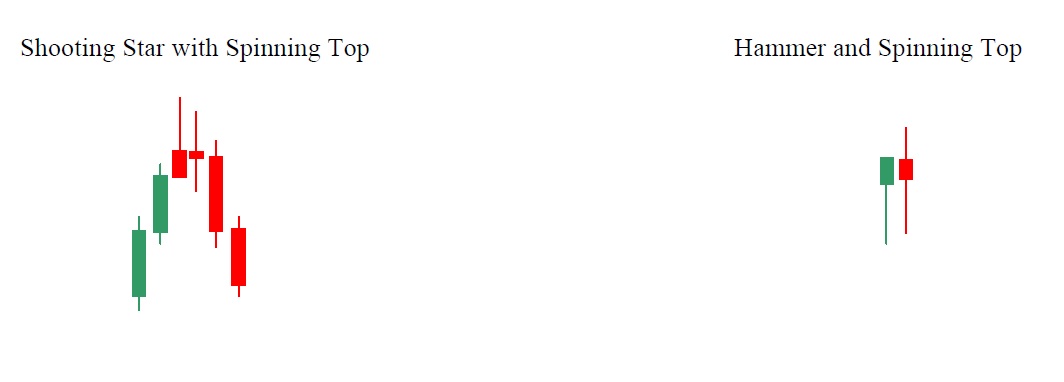
Shooting star Bearish at top of trend
A shooting star can mark a return and should be checked. This is an indicator of shortening the trend of winning (the long upper shadow is soft, such as higher prices may be reduced.)
Shooting Star (Shooting Star is the top candle) (Inverted Hammer)
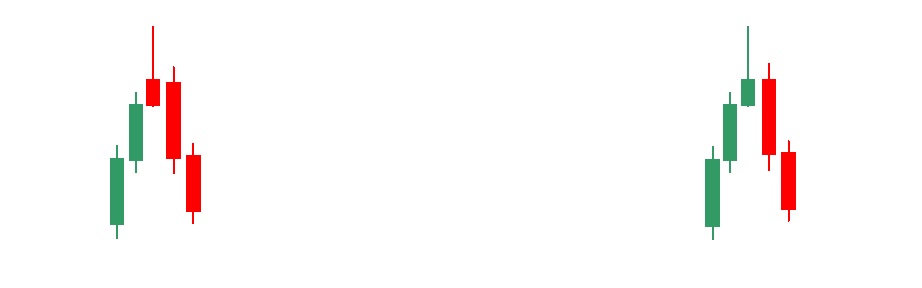
Sometimes you get a model with four candlesticks. They consist of an additional candle such as a doji or a rotating countertop. When this happens, the model gains additional strength and is more reliable. Also, when the hammer appears with a rotating hob or doji, the result is stronger and more reliable.
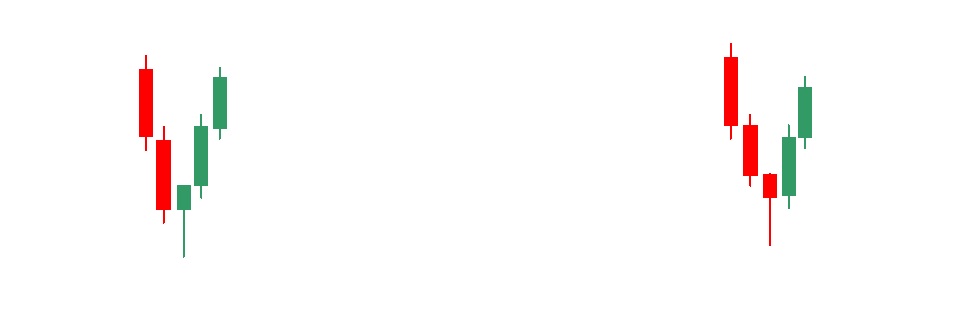
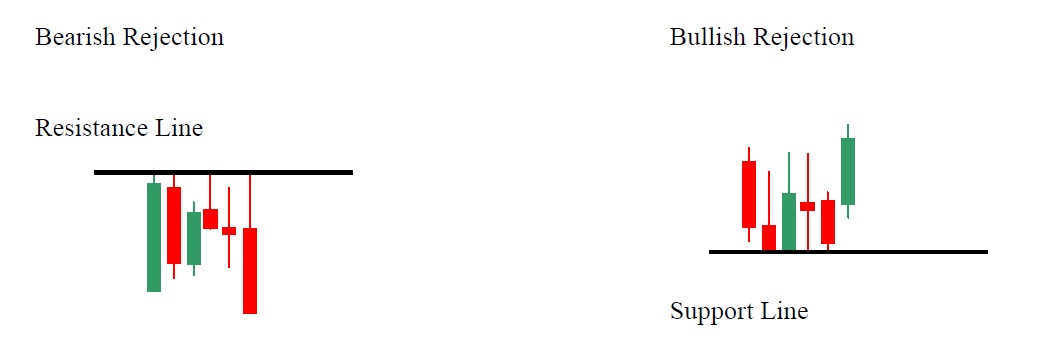
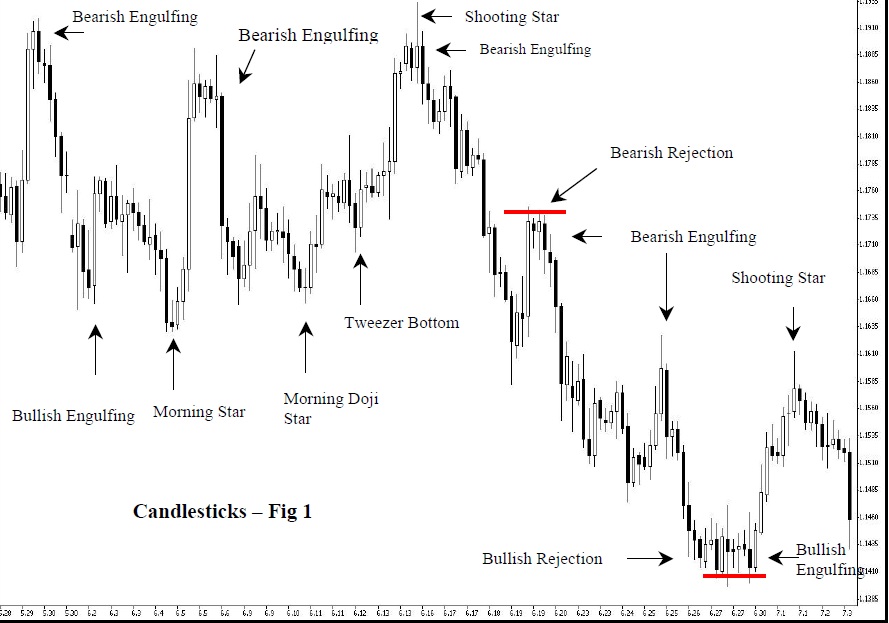
Bullish and Bearish Rejection Patterns
The Bullish and Bearish Rejection patterns are reversal patterns and occur in conjunction with support and resistance lines. When the currency pair attempts to breach the support or resistance line and fails it has been rejected at that level and reverses.
There are many more combinations of candlestick patterns. We have selected just a few that work well for us and have limited the number to make things easier.
Following this section, a number of diagrams are presented showing candlestick patterns in their various shapes.
Candlestick Analysis – (Japanese Candle Analysis)
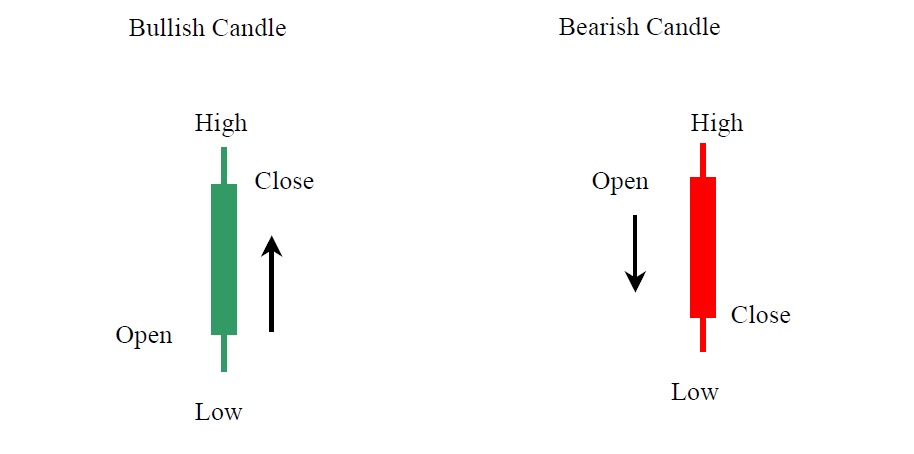
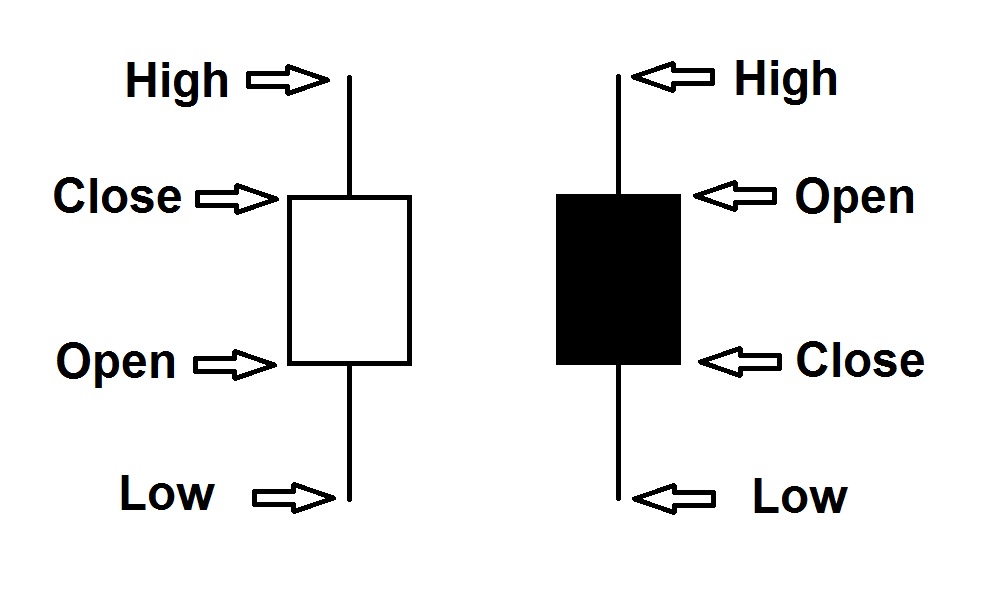
The body is called the wide part of the candle, and the thin lines above and below the body are called upper and lower shadows, respectively. If there is no peak in the candle, we say that the top is cut off. If there is no lower shadow in the candle, we have a cut off base. The Japanese believe that the most significant price movements are reflected by the candle body. The shadow is seen as a minor price fluctuation.
Common types of candles observed:
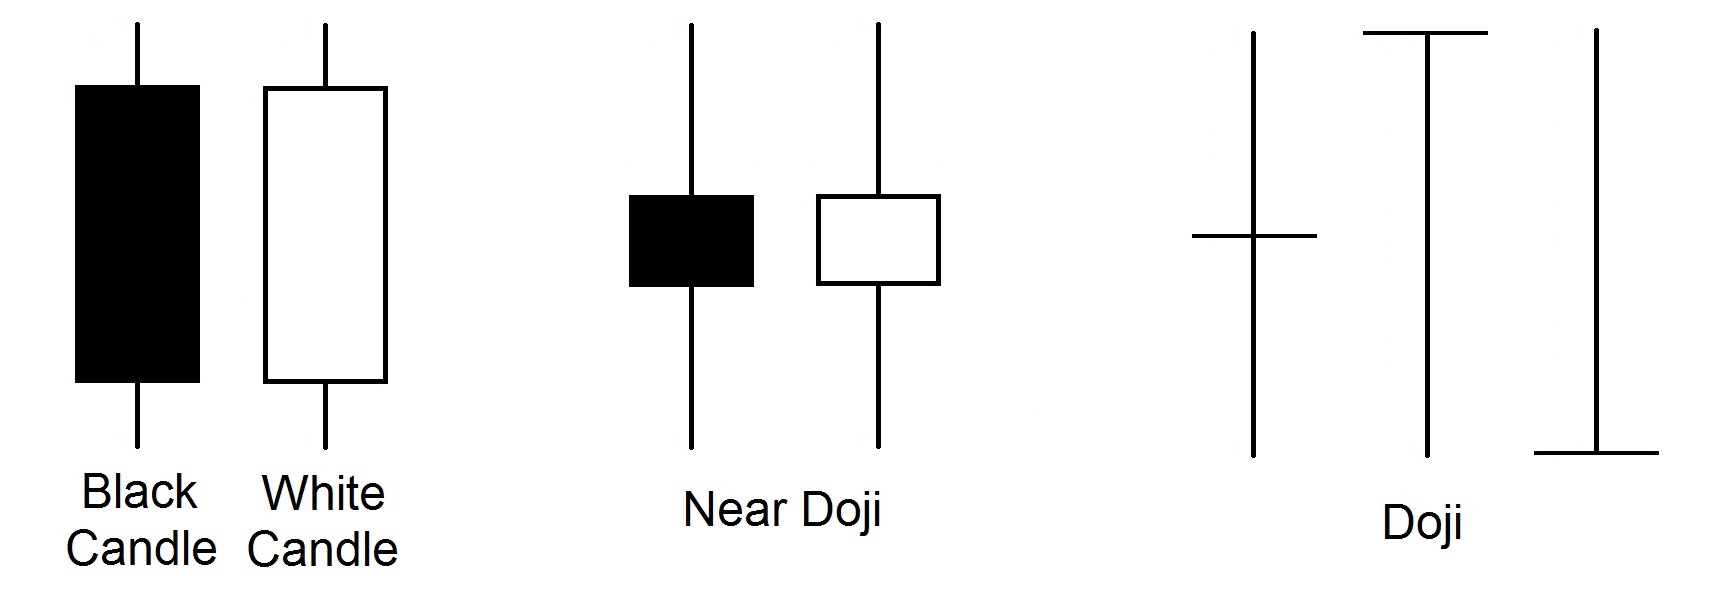
The black candle corresponds to the bearish period of market development, the white candle corresponds to the bullish period. Spinning top signal indecision. They occur within the narrow trade corridor and are essential in the formation of certain graphic models. The main feature of the spinning top is the small body. The size of the shadow is not essential. In Japan, the black candle is called the “in-sen” (black line) and the white “yo-sen” (white line).
The opening price determines the further development of day trading. Sometimes strong traders try to move the market at the moment of opening the session by making large purchases or sales – the Japanese call this a “morning attack”.
The closing price is another key point, ie the requirement to deposit additional bets on the futures market based on closing prices. If a sales or purchase order is placed near the close of the day’s trading, or just before the close of the trade, in order to influence the closing price, the Japanese call it a “night attack”.
Models of reversal of movement
The traffic reversal signal indicates that the old trend has ended and the market has moved either in the plane or in the opposite direction of the previous trend. In this case, after movement on the plane, the original trend can be resumed. A traffic reversal indicator is a sign that says, “Attention-trend, situation is in the process of changing.”
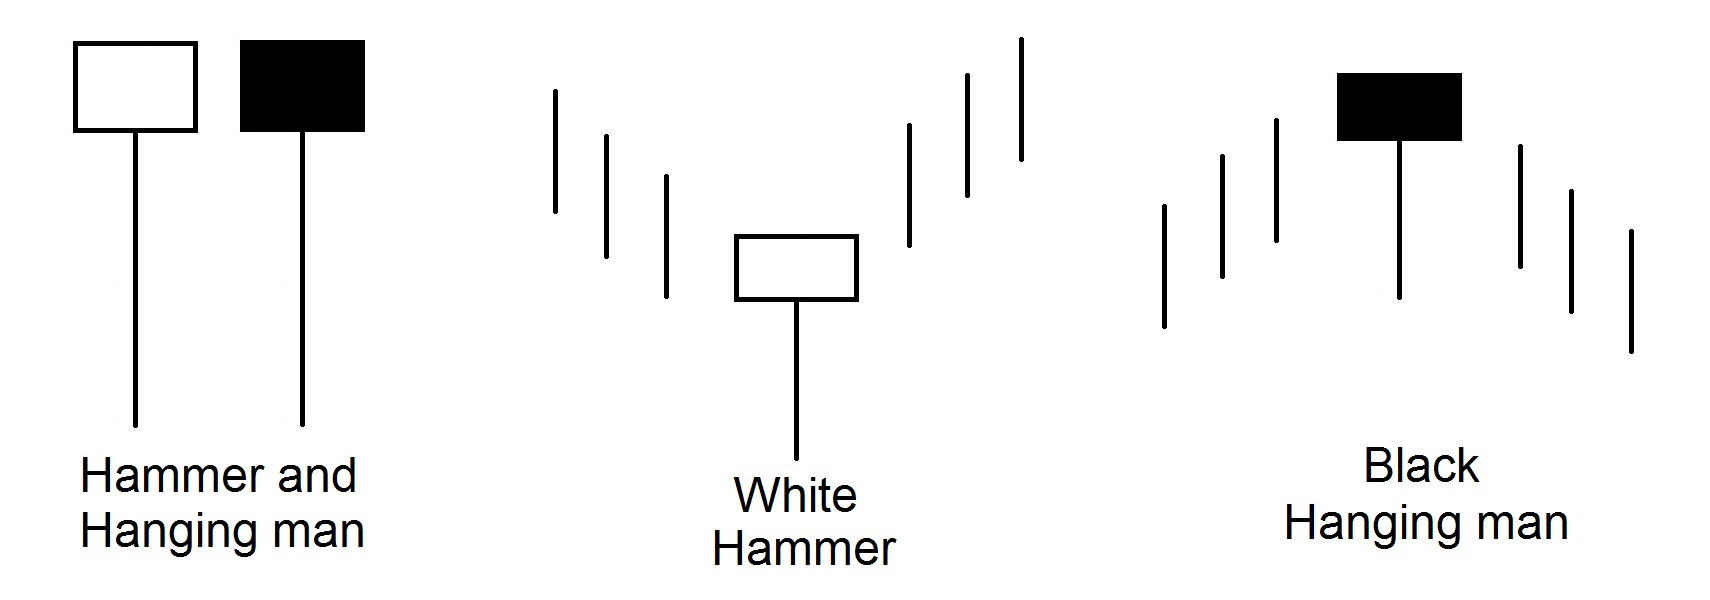
The appearance of a candle with a small body and a long lower shadow in a downward trend is a signal that its dominance in the market is at an end. In this development, the candle is called a hammer. It means something like “trying to measure the depth by touching the bottom with your foot.” The appearance of a candle with a small body and a long lower shadow in an upward trend is a signal that its dominance in the market is coming to an end. In such a development, the candle is called hanging man.
There are three main signs of hammer and hanging man:
- The body is at the top of the price range. Body color doesn’t matter.
- The lower shadow is twice as long as the body.
- The candle has no peak shadow or is very short.
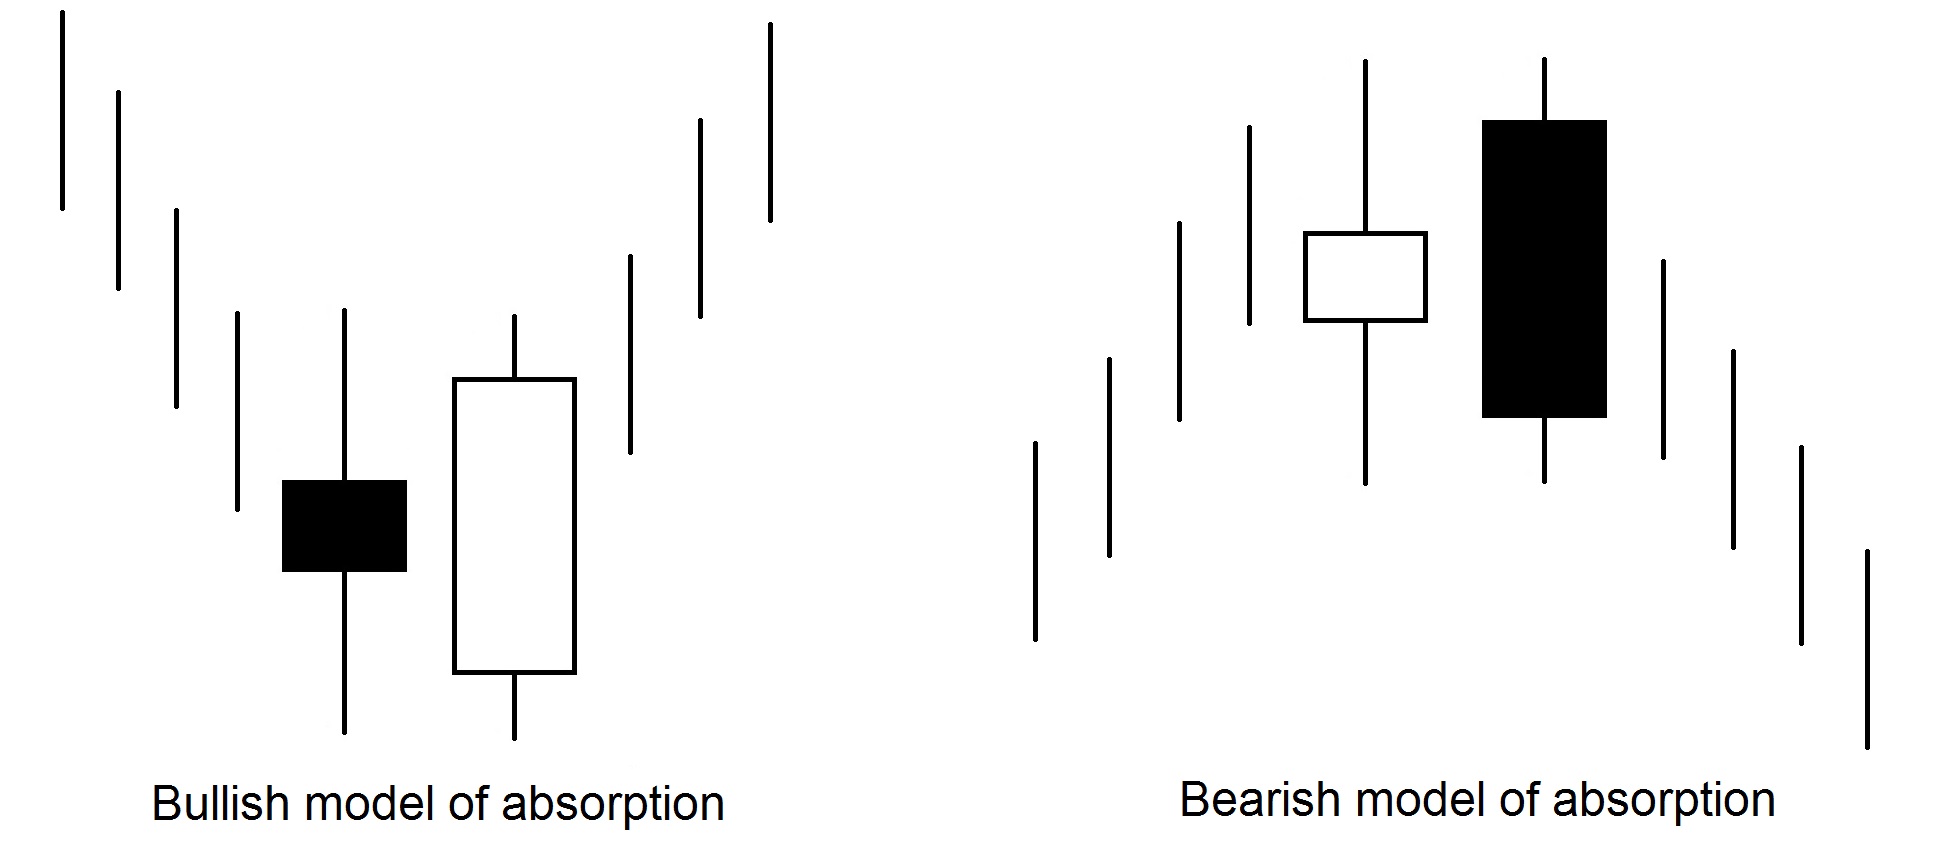
Absorption model
There are three criteria:
- There should be a strong upward or downward trend (even in the short term) on the market.
- Two candles form the absorption pattern. The body of the second candle swallows the first (shadows may not be swallowed).
- The second body should be contrasting in color with the first.
- (An exception to this rule is when the body of the first candle is so small that it is comparable to doji (or is doji). In this situation, after a long descending trend, a fragile white body swallowed by a very large white body may to signal the formation of a bottom and the beginning of a reversal of movement, whereas in an upward trend a very small black body engulfed by a large black body of the second candle signals the formation of a peak and the beginning of a reversal of movement.
Dark Cloud Cover
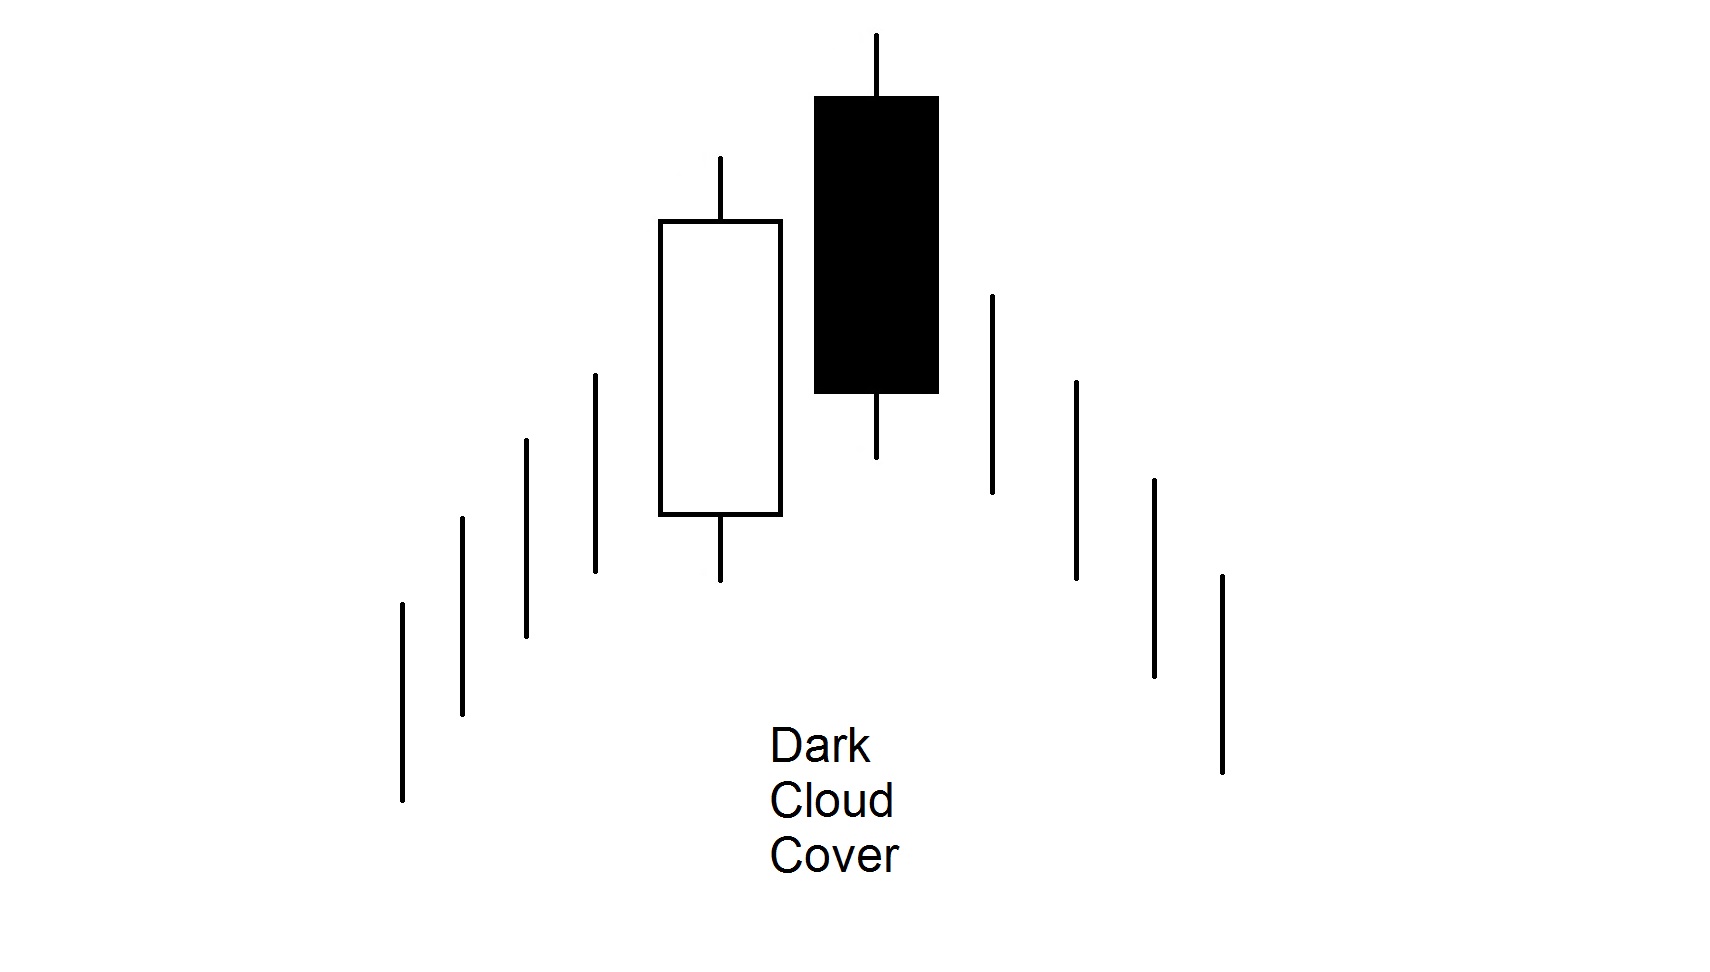
Model criteria:
- It consists of two candles appearing in an upward trend (or in the upper limit of the price corridor).
- The first candle – white with a strong body. The next day, the opening price exceeds the maximum of the previous day, but the closing price approaches the daily minimum and conceals a significant part of the white body of the previous candle. The lower the closing price for a black candle, the more likely it is to tip. Japanese analysts estimate that the cost of closing the black candle should cover 50% of the body of the white candle.
- The meaning of this model is as follows: The market is in an upward trend, the new trading session is opened after the white candle with Gap at the top. The bulls are in full control of the situation, but then the price halt stops. In addition, the closing price drops to or near the daily minimum and covers a significant portion of the body of the white candle. Bulls are thinking about their long positions. On the other hand, bears receive a stop order (the maximum of the second (black) candle from the model).
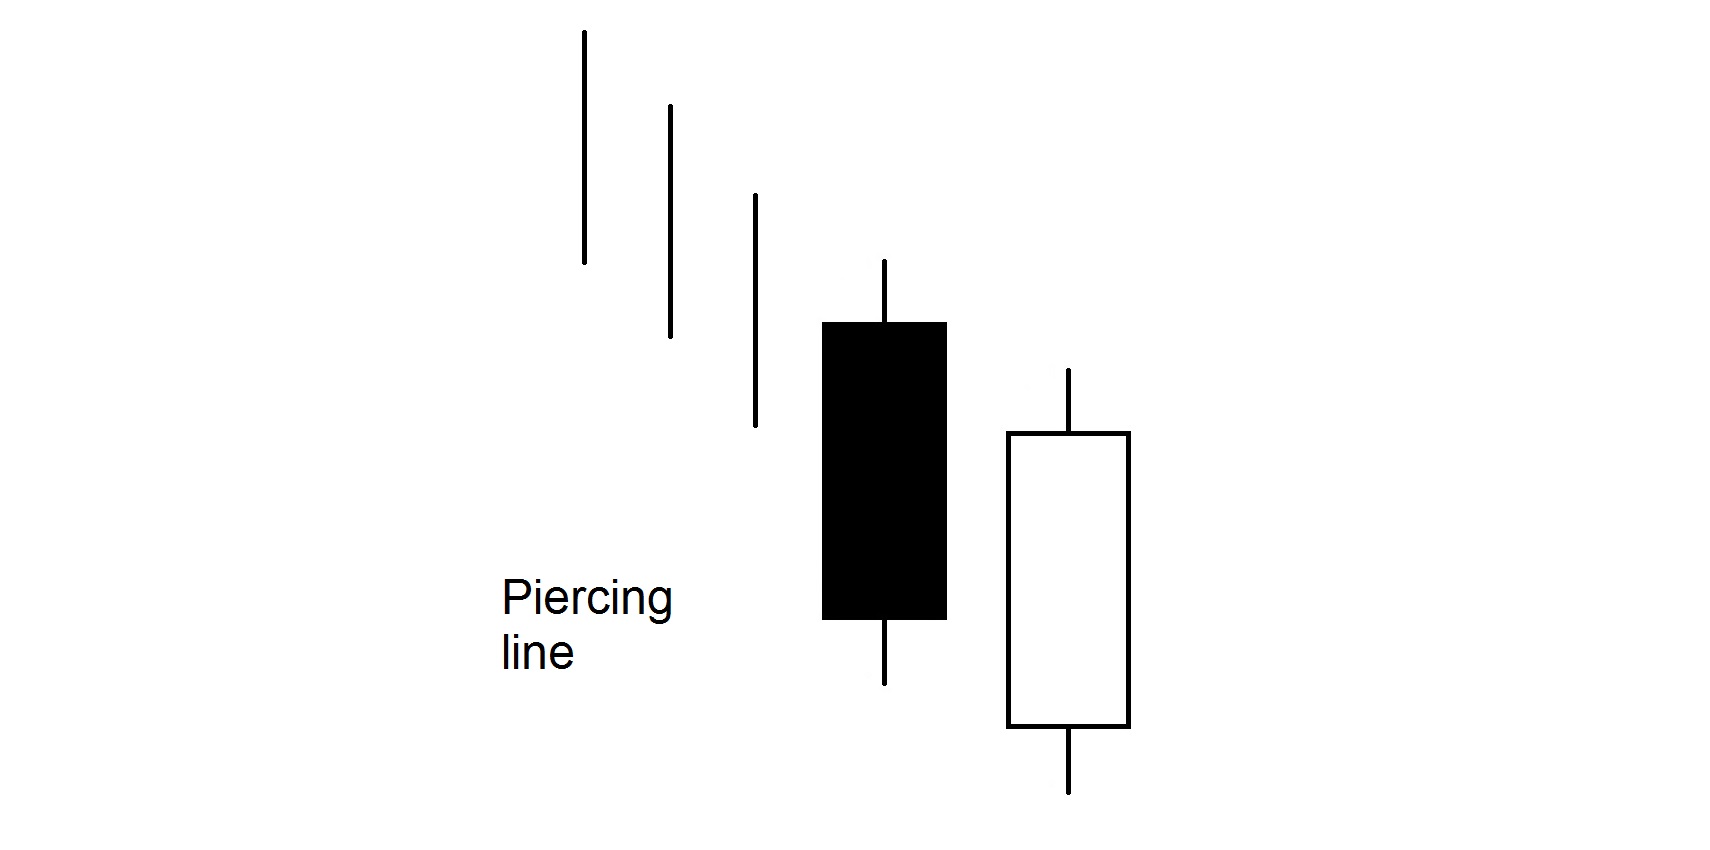
Piercing Line
Model criteria:
- Consists of two candles and appears on the market.
- The body of the first candle is black and the second is long white.
- The white candle is opened at a much lower price low than the previous candle. The price then rises, closing higher than the middle of the body of the black candle. The significance of the piercing line model is determined by the same factors as the dark cloud cover model, but in a mirror image.
Star
Star – is a small body candle that forms a price Gap with a previous large body candle. The main condition – Gap between the bodies. Shadows can intersect. The color of star does not matter. If star consists of doji, then it is called doji star. Star formations, especially doji star alerts, to start reversing. The small body indicates that there is no advantage in the fight between bulls and bears. With a strong upward trend, the appearance of doji star may be due either to a decline in bull activity and strength or to an increased interest in sales and activation of bears. In both cases, the doji star signals a reversal of the upward trend and possible upward movement.
Star formations are part of four motion reversal models: Evening star, Morning star, Doji star and Shooting star. In all models, the star formation body can be in any color.
Morning Star
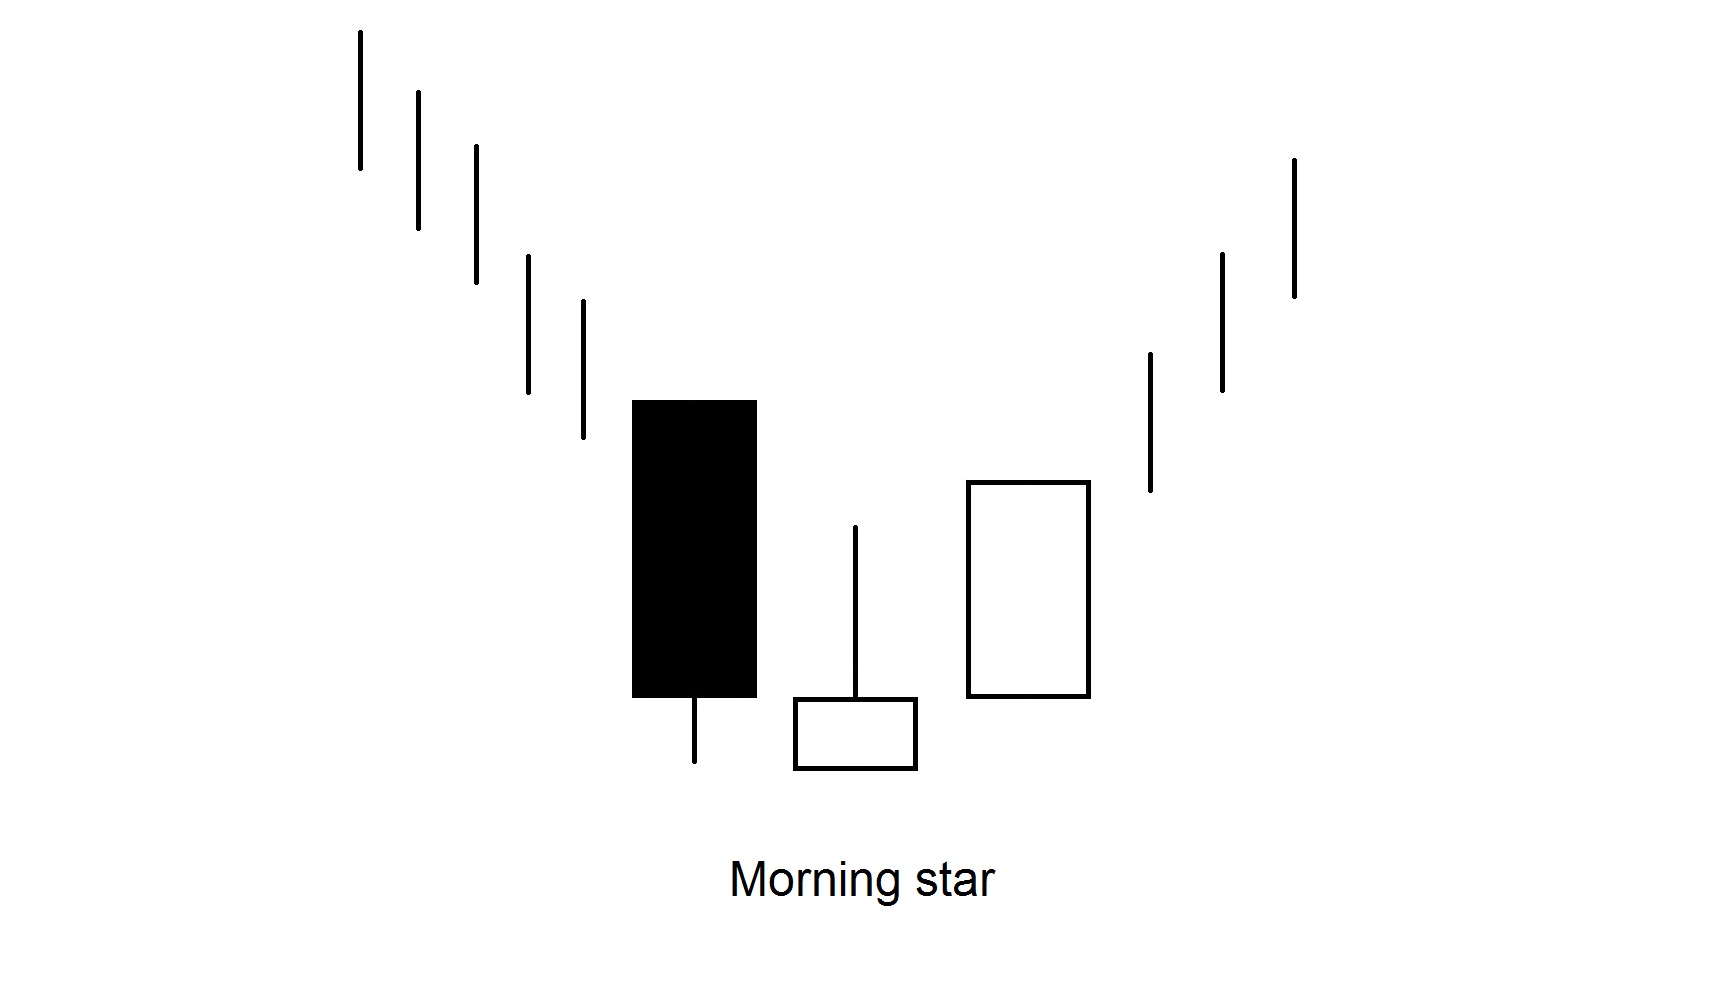
This is a model of movement reversal at the base. It consists of a candle with a long black body, followed by a Gap down followed by a candle with a small body. On the third day, a white candle arises, the body of which conceals a significant portion of the body of the black candle from day one. When we see a black candle, prices fall – the bears guide. Then small-body candles emerge – the strength of the bear diminishes. The appearance of a strong white body indicates that the bulls begin to tip. Ideally, there is a Gap before and after the middle of doji star. But a second gap is rarely observed, which does not diminish the significance of the model. The main criterion is the degree of penetration of the body of the third candle into the body of the first candle.
Evening Star
This is the bearish double of the morning star formation.
Morning Doji Star and Evening Doji Star
Here, doji-shaped candles appear as stars. A Gap with the previous candle is needed – in the upward market Gap above the previous maximum and in the downward market Gap below the previous minimum. Confirmation of the presence of the evening doji star comes with a Gap down and a black candle with a body covering a significant portion of the white candle preceding the doji star. The description of morning doji star is similar to the description of evening doji star, but in the opposite direction. Morning doji star and evening doji star are considered to be more important in designing a reversal pattern than just morning star and evening star formations.
The presence of a star-doji burst upward from the previous white candle and the subsequent black candle is a very strong signal to form a peak and stop the upward trend. This kind of evening star-doji is also called “Left Baby in an Upward Trend”. A morning star-doji of this type is called “Left baby in a downward trend”, and both formations are extremely rare.
Shooting Star and Inverted Hammer
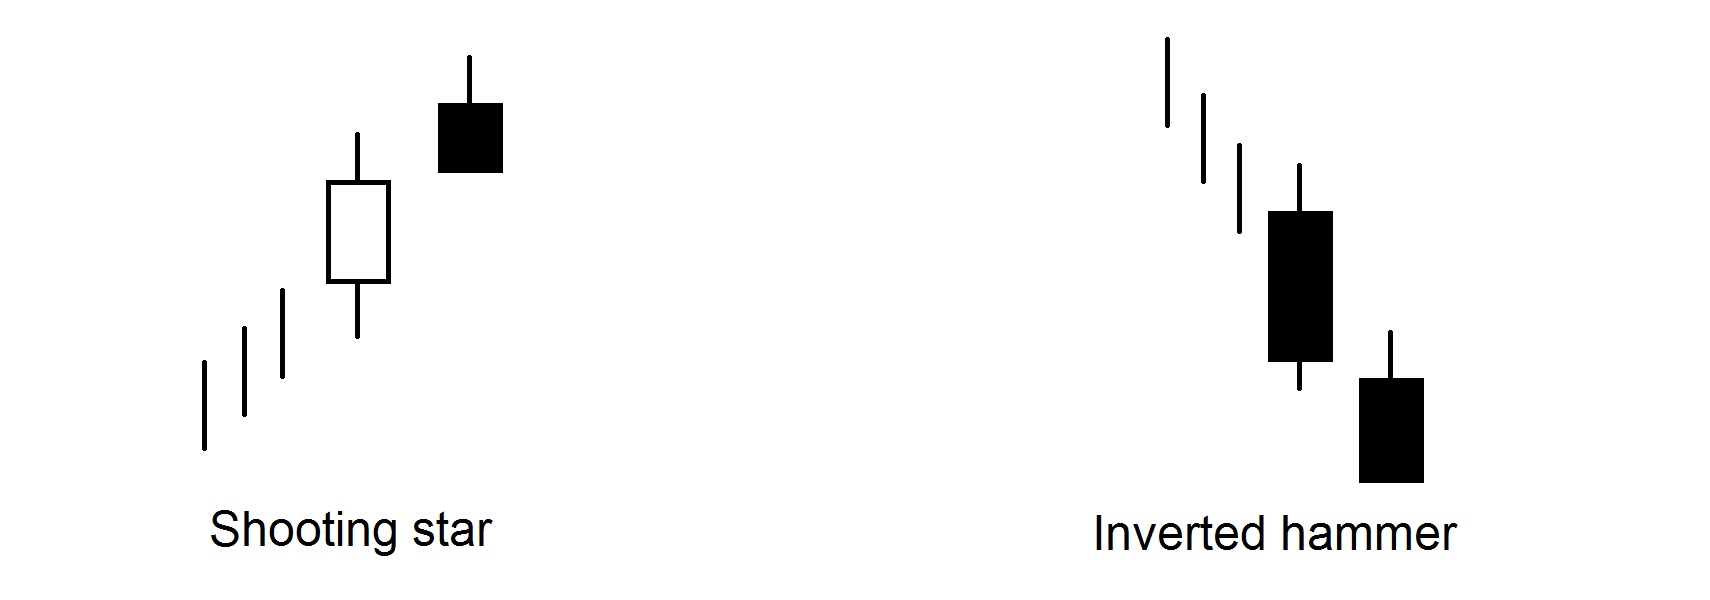
The shooting star model consists of a candle and forms a possible peak in the presence of an upward trend. This model is not among the main traffic reversal models like morning star. The shooting star’s body is not large and is in the lower parts of the candle’s price range. The top shadow is long, the body color doesn’t matter. Shooting star shows that the trading session was opened near the daily low, then the price rose sharply and dropped again, so that the closing price is close to the opening price. Ideally, the shooting star’s body will form a gap to the body of the previous candle, which is optional.
The shooting star candle, which appeared after a price drop and in a downward trend, could be a bullish signal; such a candle is called an inverted hammer. In order to be convinced of the bullish nature of the inverted hammer, we need to wait for the confirmation signal of the next candle. Such confirmation may occur in situations where the next day’s opening price is higher than the body of an inverted hammer. The larger the price gap, the brighter the signal.

The Harami model (translated from Japanese as “pregnant”) is a small body candle that is within the relatively long body of the previous candle. The long candle is “mother” and the short one is “fruit” or “baby”. The candles in the swallow pattern should vary in color, while in the harami it is optional. Although it often consists of contrasting candles, the second candle should have a small body and the first one a large one. The body of the second candle is located inside the body of the first. The size and relative position of the shadows do not matter; the smaller the second body, the more significant the model:

As a rule, harami confirms the completion of the previous trend and the transition in motion on the plane. Sometimes the model warns of radical changes in trends. There is a type of harami called harami cross. In this model, a doji appears instead of a small second candle. Harami cross is considered to be one of the most significant reversing signals because it contains a very strong doji.
As a rule, harami confirms the completion of the previous trend and the transition in motion on the plane. Sometimes the model warns of radical changes in trends.
There is a variant of Harami called Harami cross. In this model, instead of a small second candle, Doji appears. Harami cross is considered to be one of the most significant reversing signals because it contains the very strong Doji.
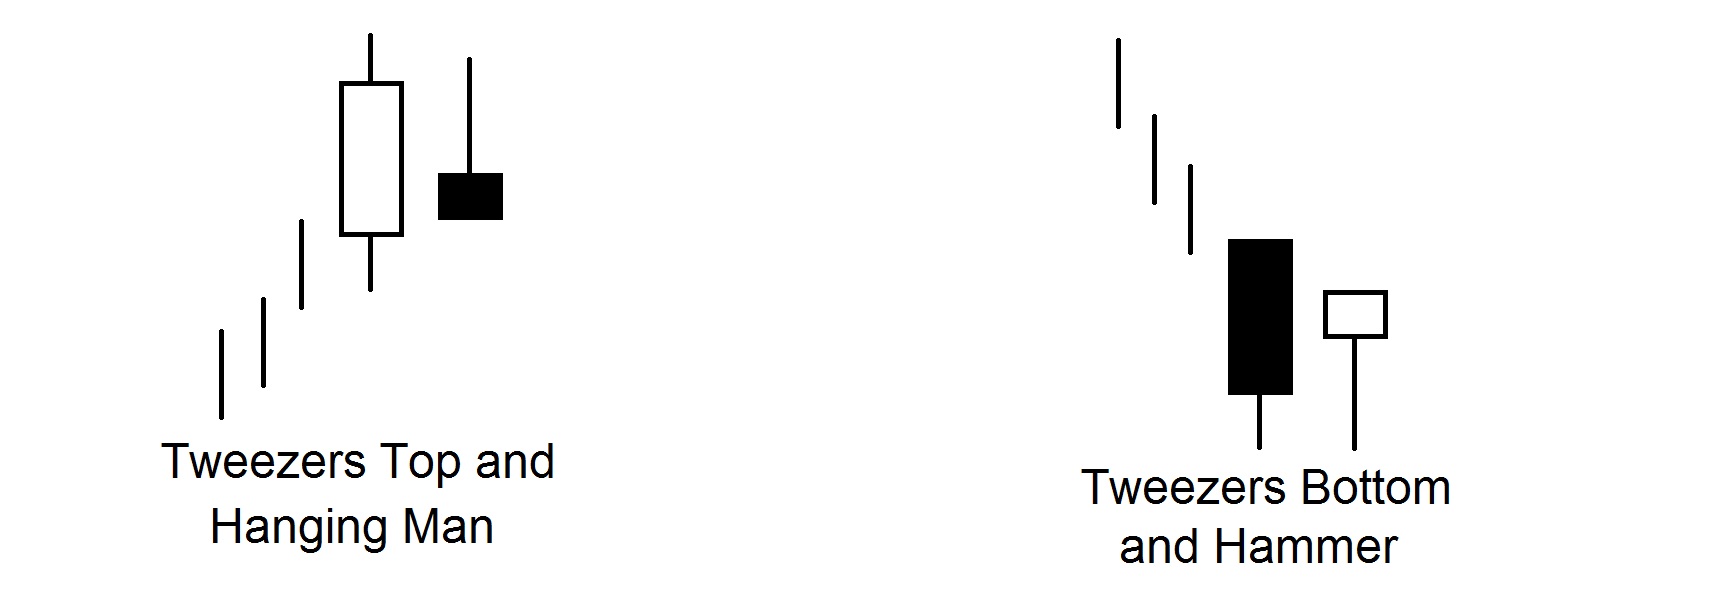
The Tweezers model features two or more candles with the same highs and lows. The name of the model means that the candles forming it resemble the split teeth of the tweezers. In a rising market, the top of Tweezers is formed where two identical price highs appear. In a declining market, the basis of the model is formed where two price lows coincide.
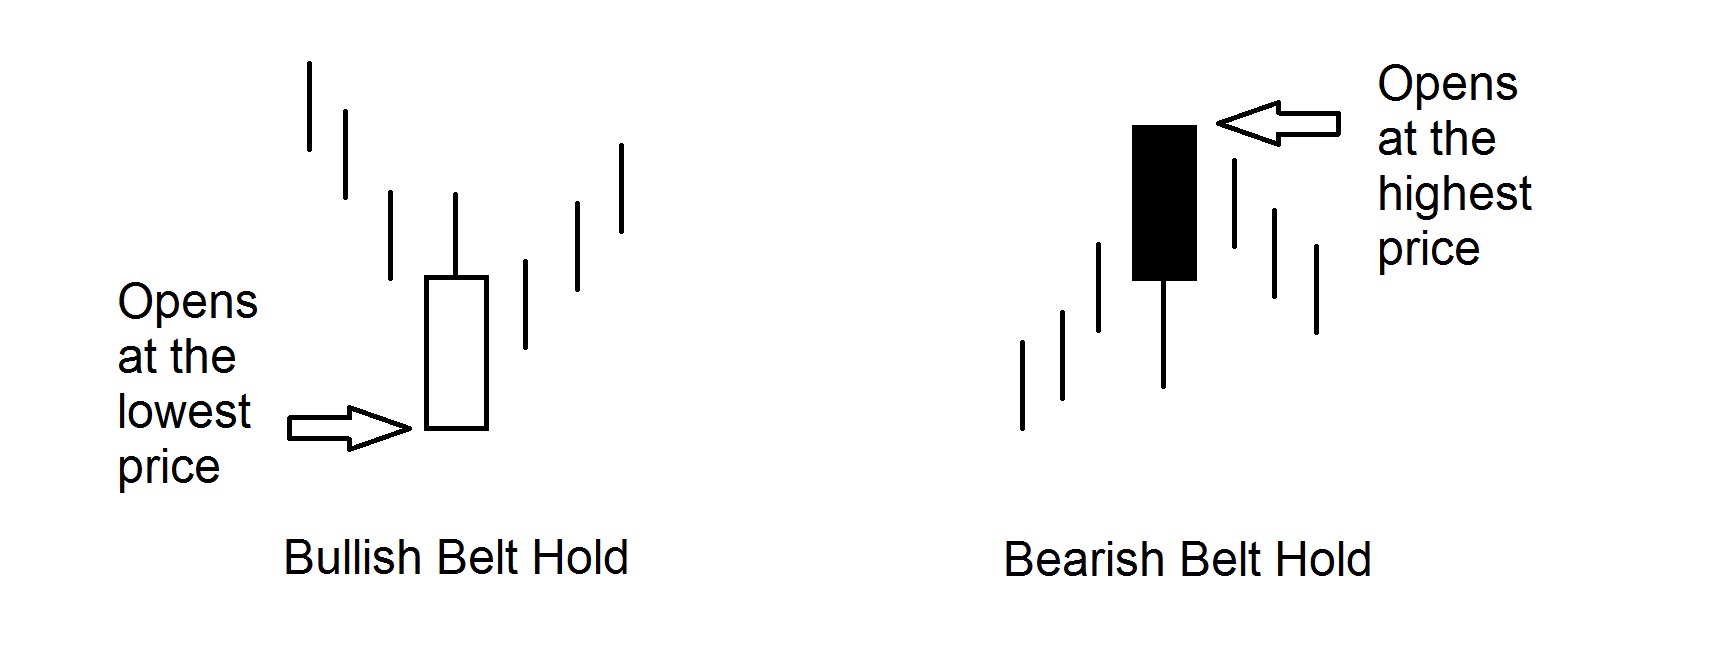
Belt Hold is a candle that has either a bullish or bearish character. The Belt Hold Scallion Candle is a long white candle that we find at the daily low (or there is a very small lower shadow) and then moves up during the day. They also call it a cut-off white candle. If the market is in the low price area and a long white Belt hold candle appears, a price increase is very likely.
The Belt Hold Bear Candle is a long black cut-off candle. If the market is in the high price area and a Belt hold candle appears, then a tip is likely to change. The longer the candle is, the more important it is to market development. These candles are more significant if they have not appeared on the chart for a long time.
The signals given by these models are neutralized if a white candle closes trading above the middle of the black Belt Hold candle, or a black candle that closes the trade above the middle Belt Hold candle. In both cases, the trend is reversed and no model of reversing is developed.
Upset Gap Two Crows and Mat-Hold models
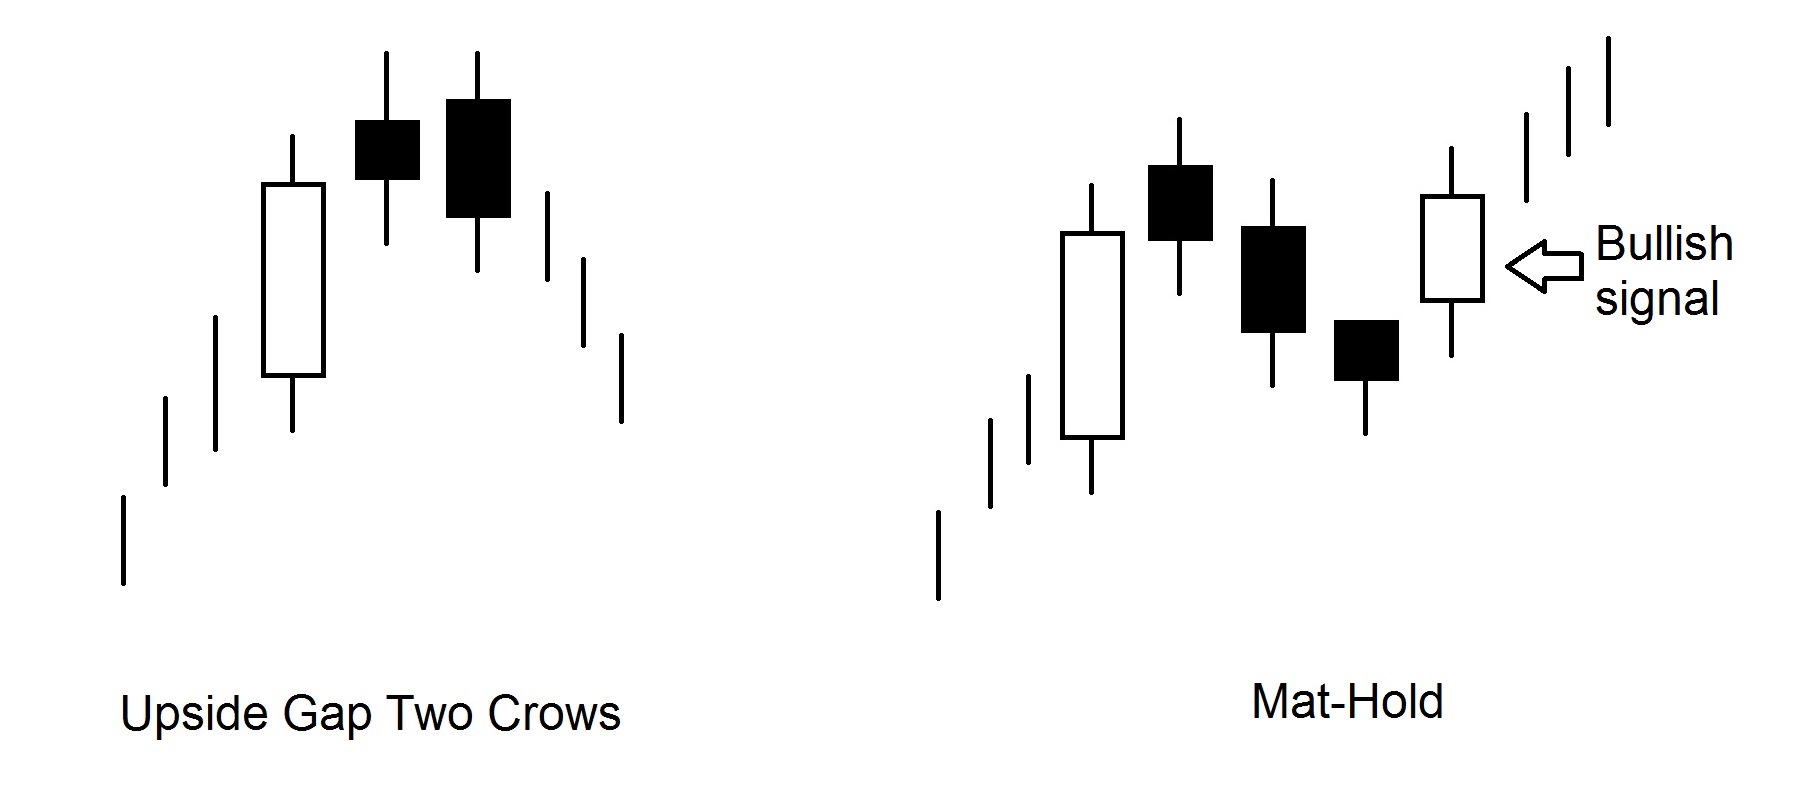
The Upside Gap Two Crows model represents the Gap between the small body of the first black candle and the body of the previous candle (as a rule, the previous candle has a long white body). This model has a bearish character. Ideally for the Upside Gap Two Crows model, the price of opening the second black candle is higher than the price of opening the first black candle, and the closing price is below the closing price of the first black candle. Although the opening price forms a Gap at the top, the new high cannot be kept throughout the day and a black candle appears on the market. But there is still some reserve for the bull as long as the closing price of the black candle remains higher than the closing price of the previous day. During the third session, the market takes on an even more pronounced bearish character: a new maximum emerges, from which the price starts to decrease until the session closes. But the biggest downside is that the closing price is lower than the previous day. This means that the bulls are losing positions. If the price fails to move to the top on the fourth day, prices are expected to fall.
There is a model reminiscent of Upside Gap Two Crows, but of a bullish character. This is the so-called Mat-Hold. The first three candles are similar to the Upside Gap Two Crows candles, but are followed by another black candle. If the next candle turns white and its opening price forms a Gap with the top shadow of the last black candle, or its closing price is higher than the maximum of the last black candle, then you can buy. This model includes two, three or four black candles. Upside Gap Two Grows and Mat-Hold are quite rare. Mat-Hold’s main difference is the appearance of a white candle at the end of the model, which turns it into a bullish signal. Therefore, when opening positions based on Two Grows, the stop-loss order level is best served by the peak maximum prices of the second black candle.
The Three Black Crows model
If three consecutive descending black candles appear on the chart, then the Three Black Сrows model appears. If this model emerges after a long uptrend or in the high price range, it can be seen as a signal for a fall in prices. Closing rates for all three candles should be at or near the minimum session prices. The cost of detecting each candle should be located inside the body of the previous candle.
Analysts’ confidence in this model will be greater if the body of the first candle in the Three Black Сrows range is lower than the white candle maximum of the previous session.

If the price for finding the second and third black candles is at the level of the price when closing the previous black candle (or near it), the model is called Three Equal Black Crows. They are considered to be a stronger bearish signal, but are very rare.
The Counterattack model
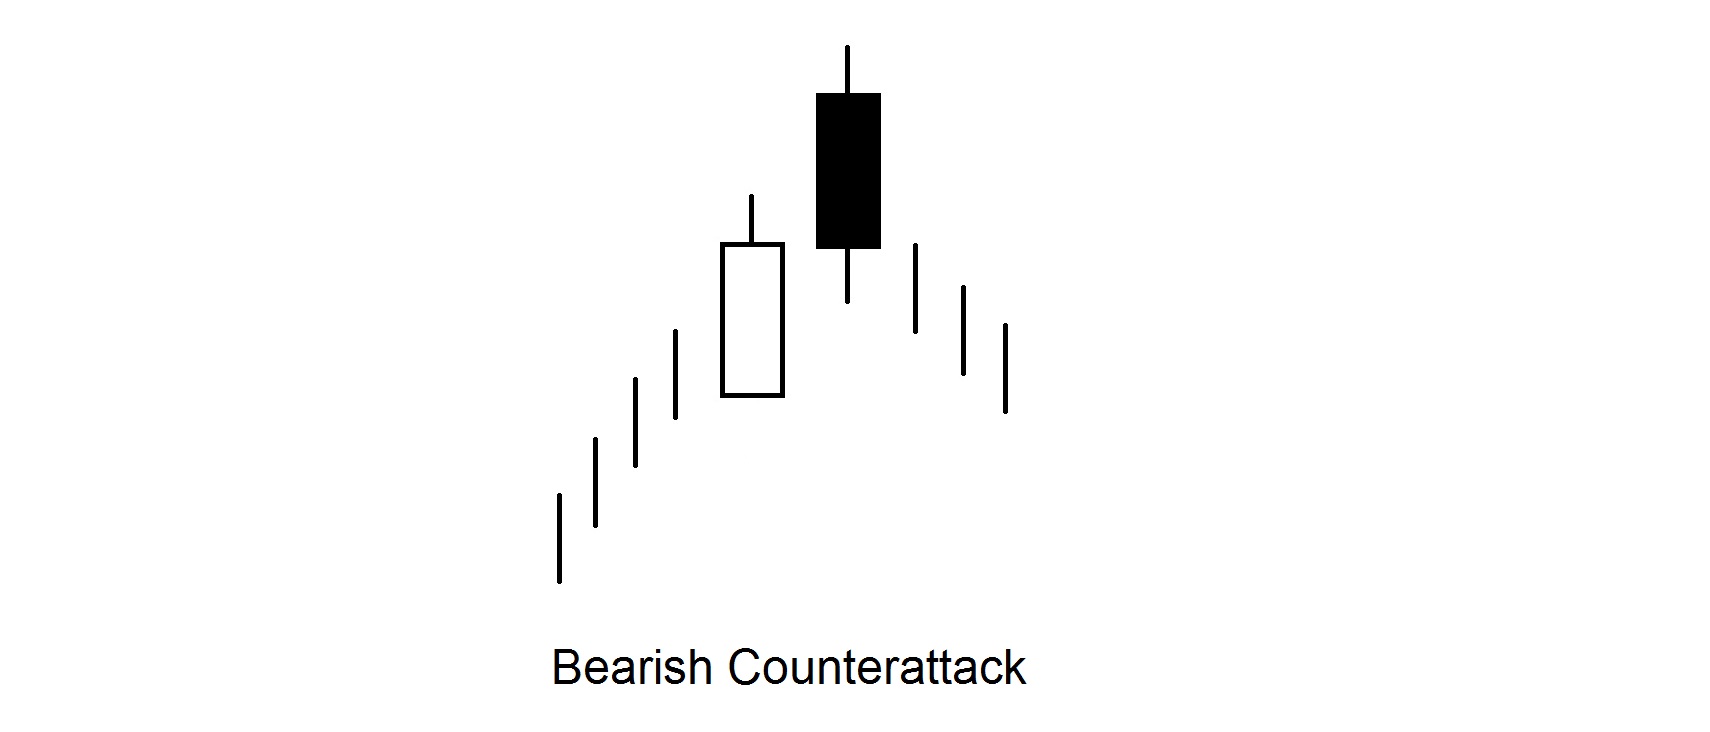
The Counterattack model is made up of two contrasting candles with the same closing price. Whiplash Counterattack occurs during a price slump. First comes the long black candle, the next session opens much lower, the bear is confident in himself. But the bull starts a counter attack, pushes prices up, so the market reaches closing prices from the previous session. The bull manages to stop the downward trend. The Bull Counterattack resembles the Piercing Line model. But the Piercing Line is a much stronger signal, ie. the white candle significantly conceals the body of the black candle.
With the Counterattack bull model, the market opens the session significantly lower than the black candle. For Counterattack swords, the conclusions are similar.
An important requirement of the Counterattack model is that the opening price of the second session must be significantly higher (in the case of Counterattack swords) or substantially lower (in the case of the Counterattack bullish) from the previous candle.
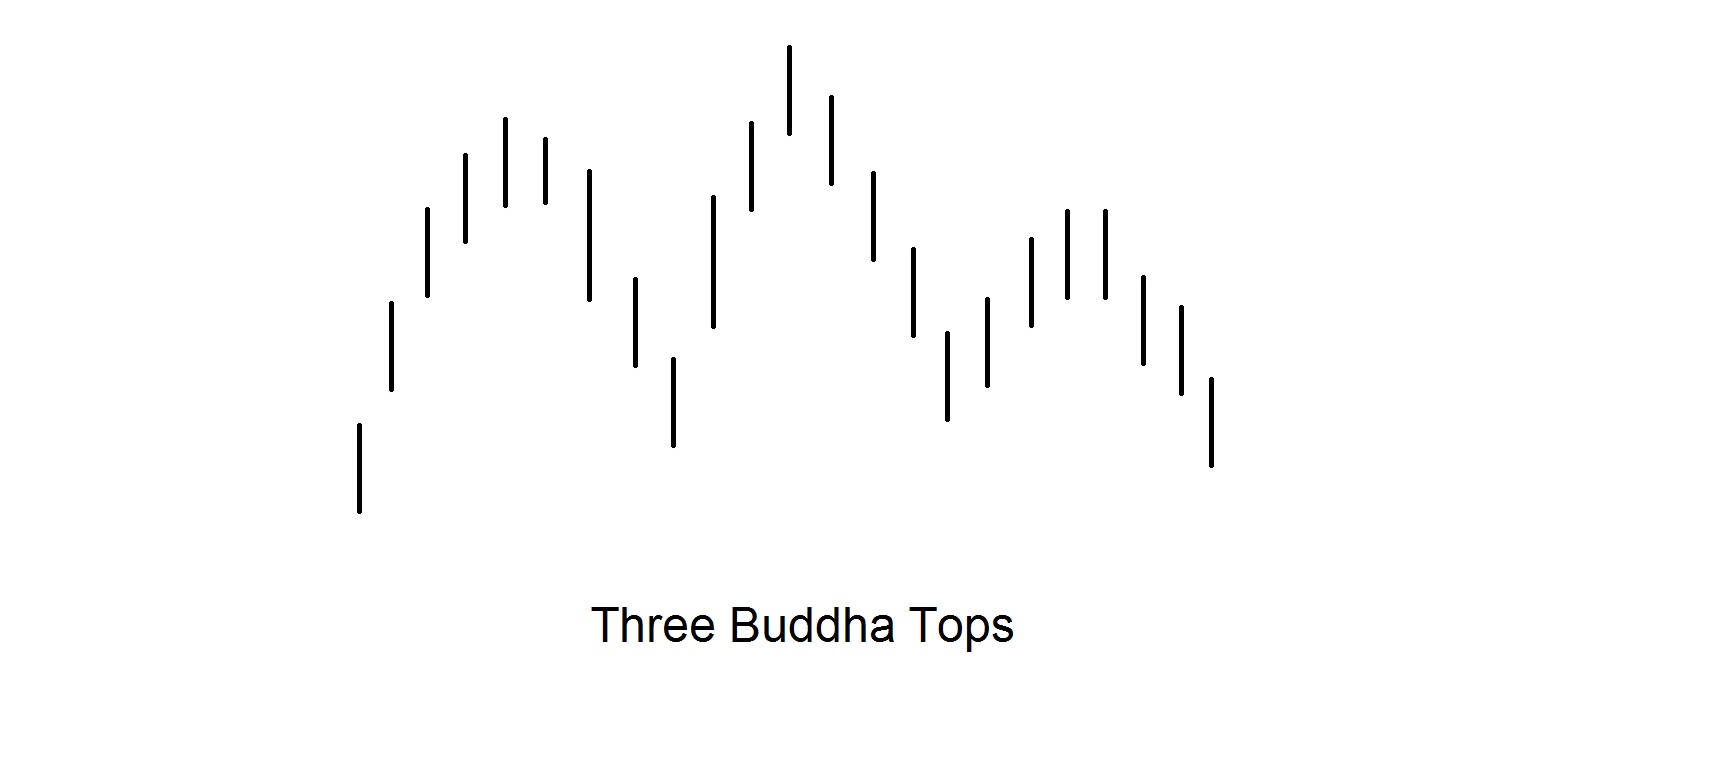
Three Mountain Tops and Three River Bottoms models
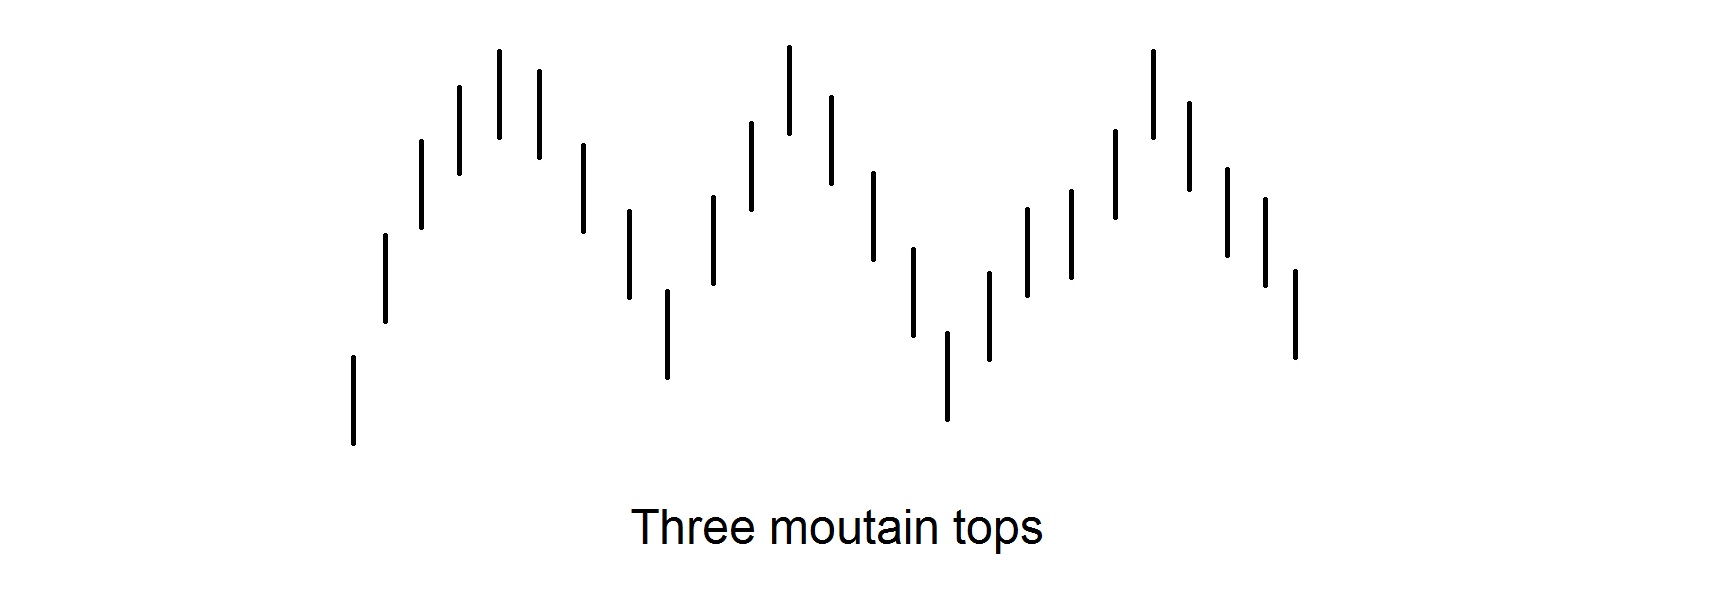
The Three Mountain Tops model is formed when the price fluctuates between the minimum and maximum three times. Three ascending waves – the tops of the last mountain should receive confirmation in the form of a bear model or candle (for example: Doji or Dark Cloud Cover). If the Three Mountain Tops model has the highest peak, then the model is Three Buddha Tops. It is analogous to the model known in the West Head and Shoulders.
The opposite of the Three Mountain Tops model is the Three River Bottoms model. Appears where the market is subject to a minimum price check three times. A base change signal is confirmed when the price exceeds the level of the intermediate peaks of the model. Very often, each top (or bottom) is formed as a certain combination of candles – a combination for reversing the movement.
We have a buy or sell signal when the neckline breaks – the line that runs through the three peaks at Three mountain tops, through the three bottoms at Three river bottoms, and through the two peaks between the three peaks at Three Buddha tops.
Dumpling Top and Fry Pan Bottom models
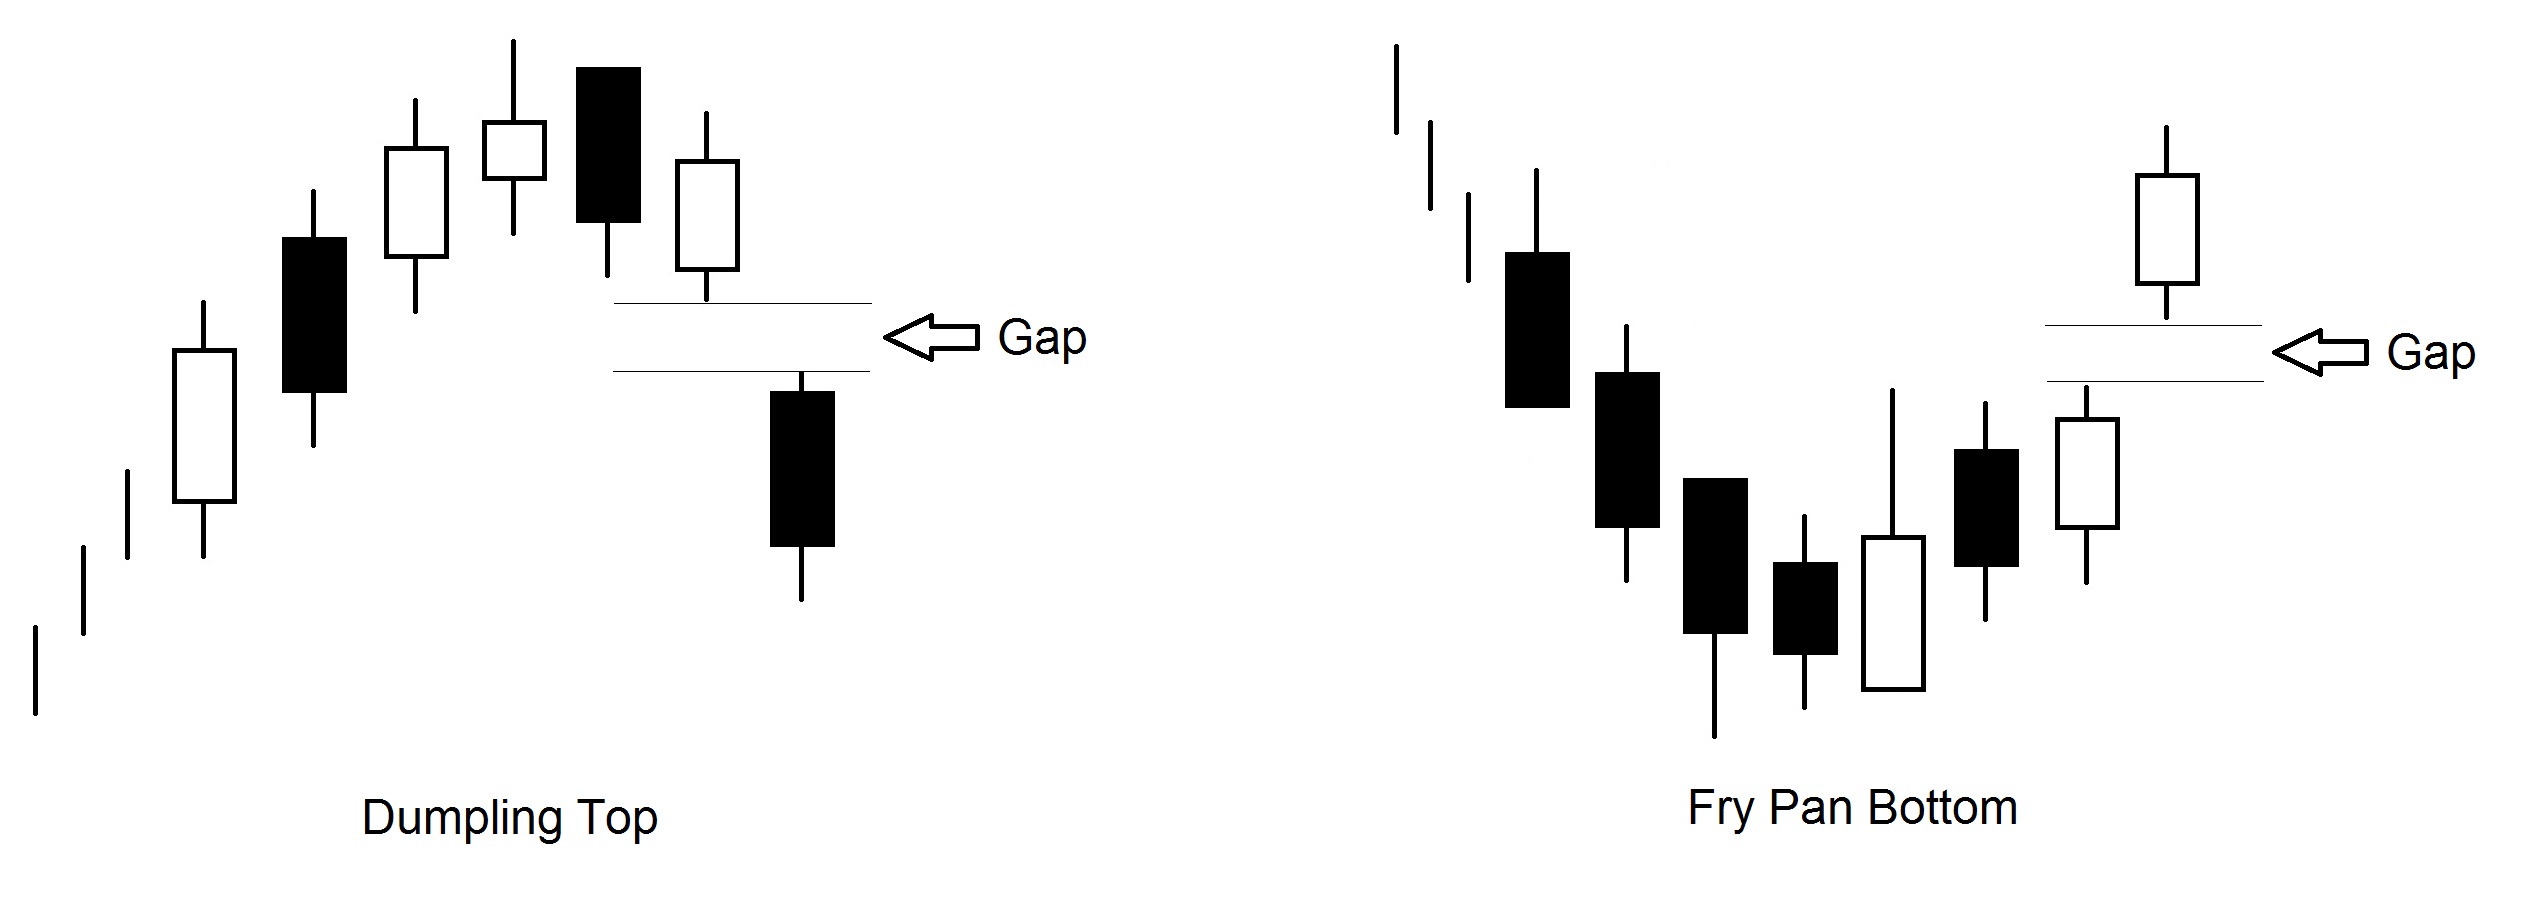
Dumpling top models are formed by candles with short bodies. The price Gap down confirms the formation of the Dumpling Top formation. The model is identical to the famous West Rounded Top. A necessary element of Dumpling Top and its confirmation is the Gap in the price down.
Fry pan bottom is formed in a downward trend when the price forms a bottom. Confirmation of the model is Gap in the price up. Externally, the model looks like the west-facing Rounded Bottom and consists of small-body candles.
The Tower Top and Tower Bottom models
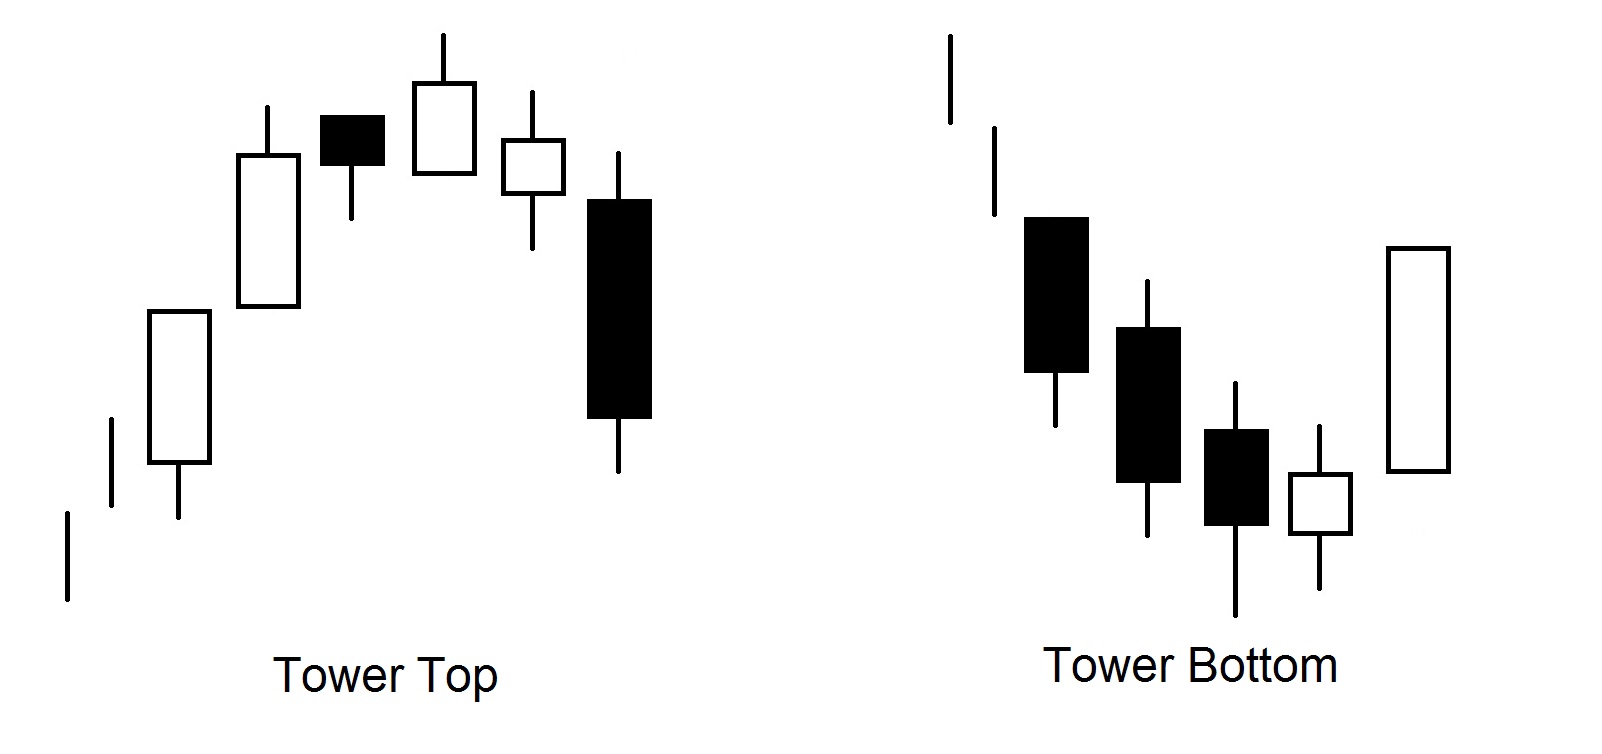
Tower Top occurs in an upward trend when a long white candle (or a series of white candles) appears. After that, the price increase slows down and begins to decline. The model is considered formed after the appearance of one or more long black candles. The long black candles in this model resemble tall towers – hence the name.
Tower Bottom is forming in the low price range with a downward trend. After the appearance of one or more black candles, there is a brief pause. Then one or more white candles appear to confirm the pattern. The closest western analogue is the V-shaped reversing model. Tower Bottom and Tower Top look a lot like Dumpling Top and Fry Pan Bottom.
The main difference is that in the Tower formations, long candles appear before and after consolidation, while Dumpling Top and Fry Pan Bottom have a Gap. In addition, the forming candles are longer than in the Dumpling top and Fry pan bottom. Both this and other models show reversing the direction of movement on the market.
The Three Rivers Bottom model

This is a downward trend signal. At first goes a long black candle, then a black candle whose closing price is higher than the closing price of the first candle; the third candle is a small body of white color. The third candle shows that the pressure from sellers has decreased.
Models of continuation of the trend
Most signals generated by the analysis of the Japanese Candle Chart are for reversing traffic. However, there is a group of models to continue the trend. As the Japanese say, “there is time to sell, there is time to buy, there is time and to relax.” Most such continuation patterns signal a break, a break in market development, before reversing the previous trend.
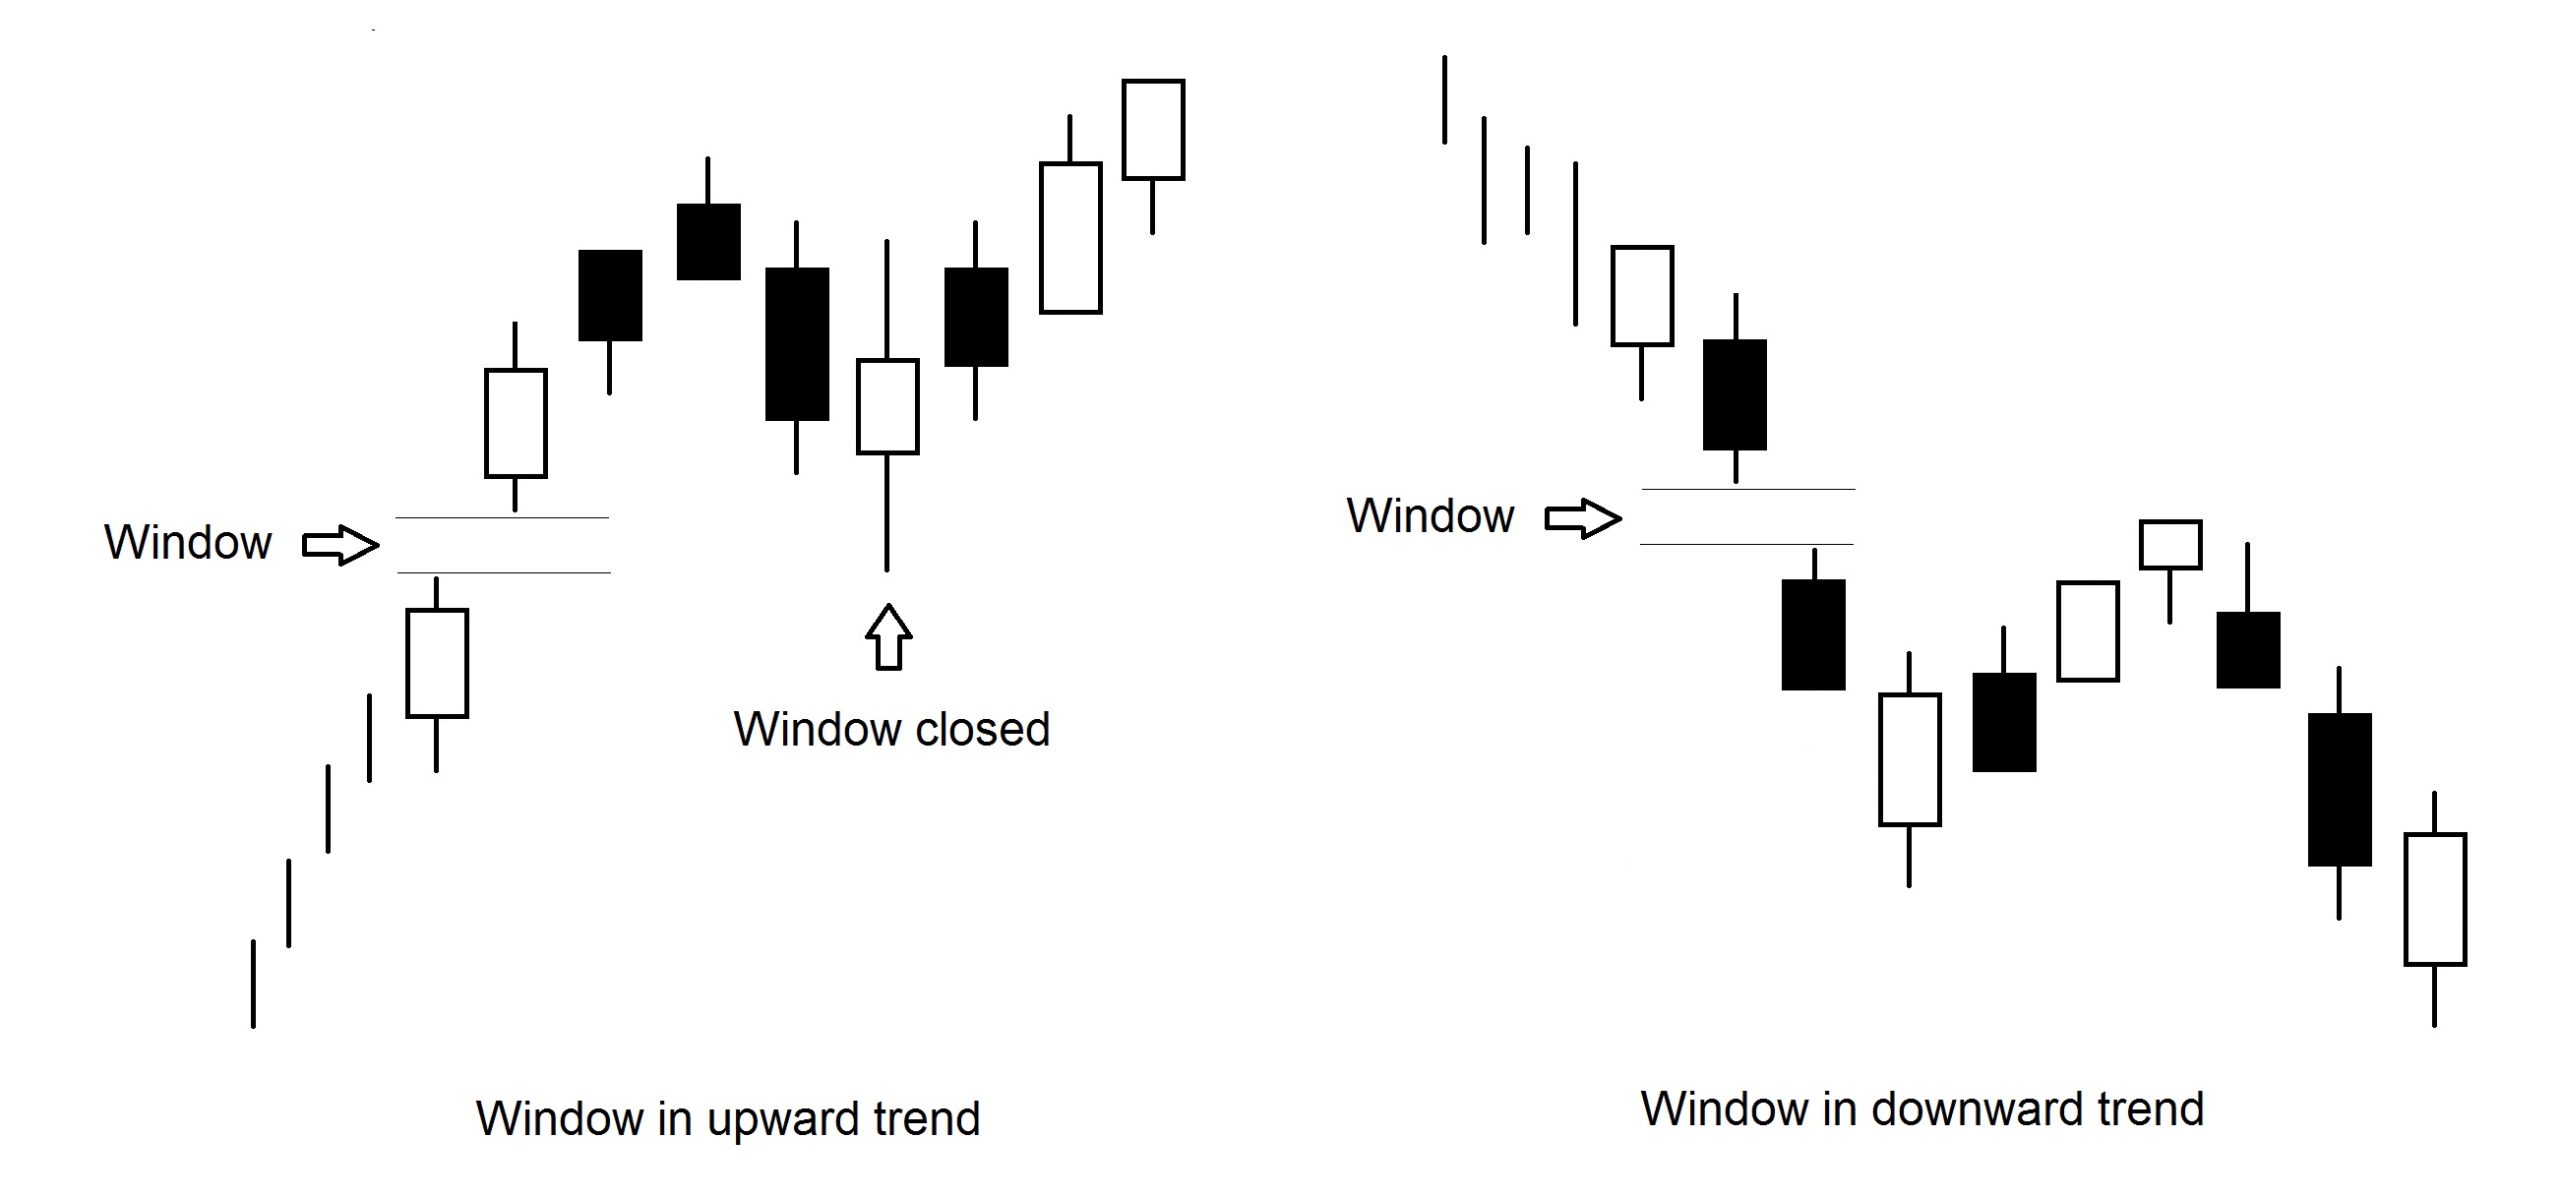
The Window Model
The Japanese call the price Gap “Window or Window”. Close the window – this is to fill the price Gap. The window is a price Gap between the extreme values for the current and the previous day. Therefore, it must be bet in the direction shown by the window. Subsequently, windows emerge as an area of support and resistance. The upward trend window is a signal to continue the rise in prices. If the window closes and the downward pressure continues, the upward trend stops and the reversal starts. The same is true in the case of a downward trend. A basic rule of thumb – with price adjustments, it is very likely that they will return to the window. Testing the upper limit of a window in an upward trend can be used as an opportunity to find a long position. The stop loss is located under the window.
The window deserves special attention when pushing the price above / below the consolidation zone, or when overcoming a previous top or bottom. In addition to the window function, such as support / resistance level and trend indicator, there are other forecast functions. For example, a price window Gap at the top of a window, especially if detected with a small black candle from a consolidation area located in the low price range, could mean a subsequent steady rise in prices.
Rule of thumb: If during an increase (decrease) we register eight to nine increases in the daily maximum (decreasing to a minimum) and no adjustments are made, then it will soon take place. For such a market, the Japanese say – “the stomach is 80% full.”
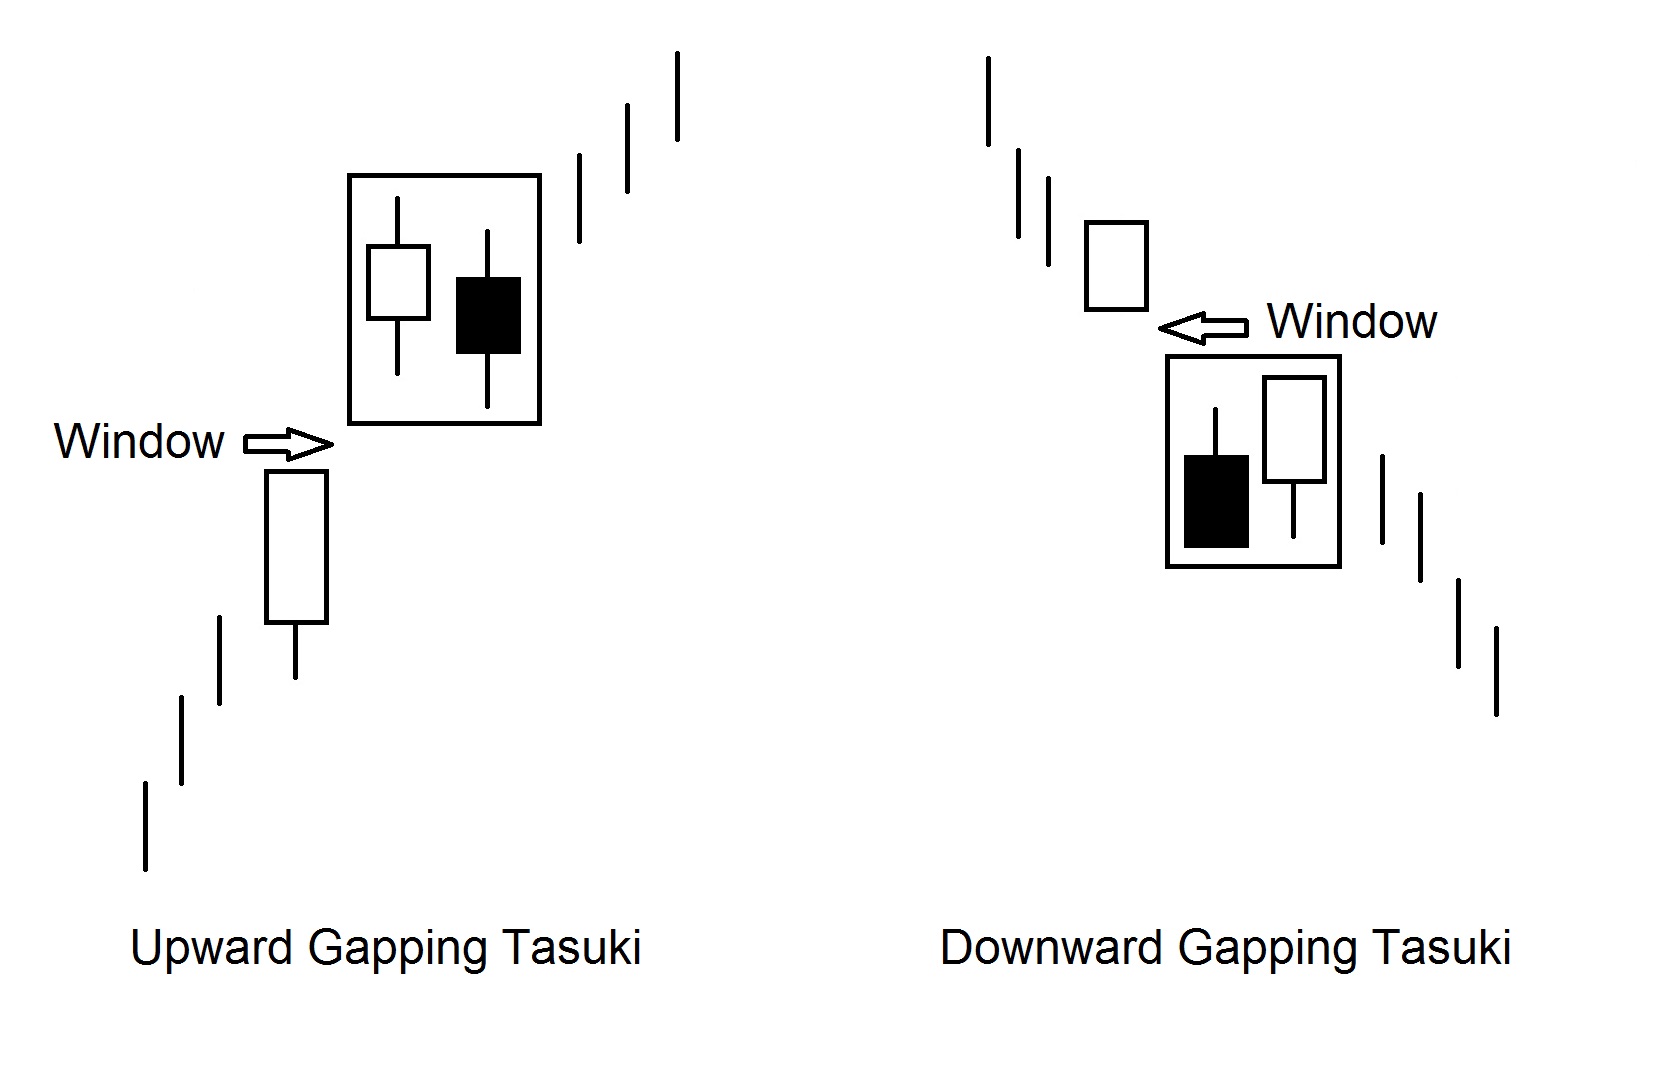
Upward Gapping Tasuki and Downward Gapping Tasuki models
Upward Gapping Tasuki is a continuation of the trend when a white candle appears and forms a window at the top – a black candle appears. The price at the opening of the black candle is within the white body of the candle, and the closing price is lower than it. The closing price for a black candle appears at the point of purchase. If the window is closed and the pressure from the sellers is still felt, the bull signal of the model is canceled. The opposite is true for Downward Gapping Tasuki. The bodies of the two candles at the time of Tasuki Gap should be approximately the same size. In practice, both models are very rare.
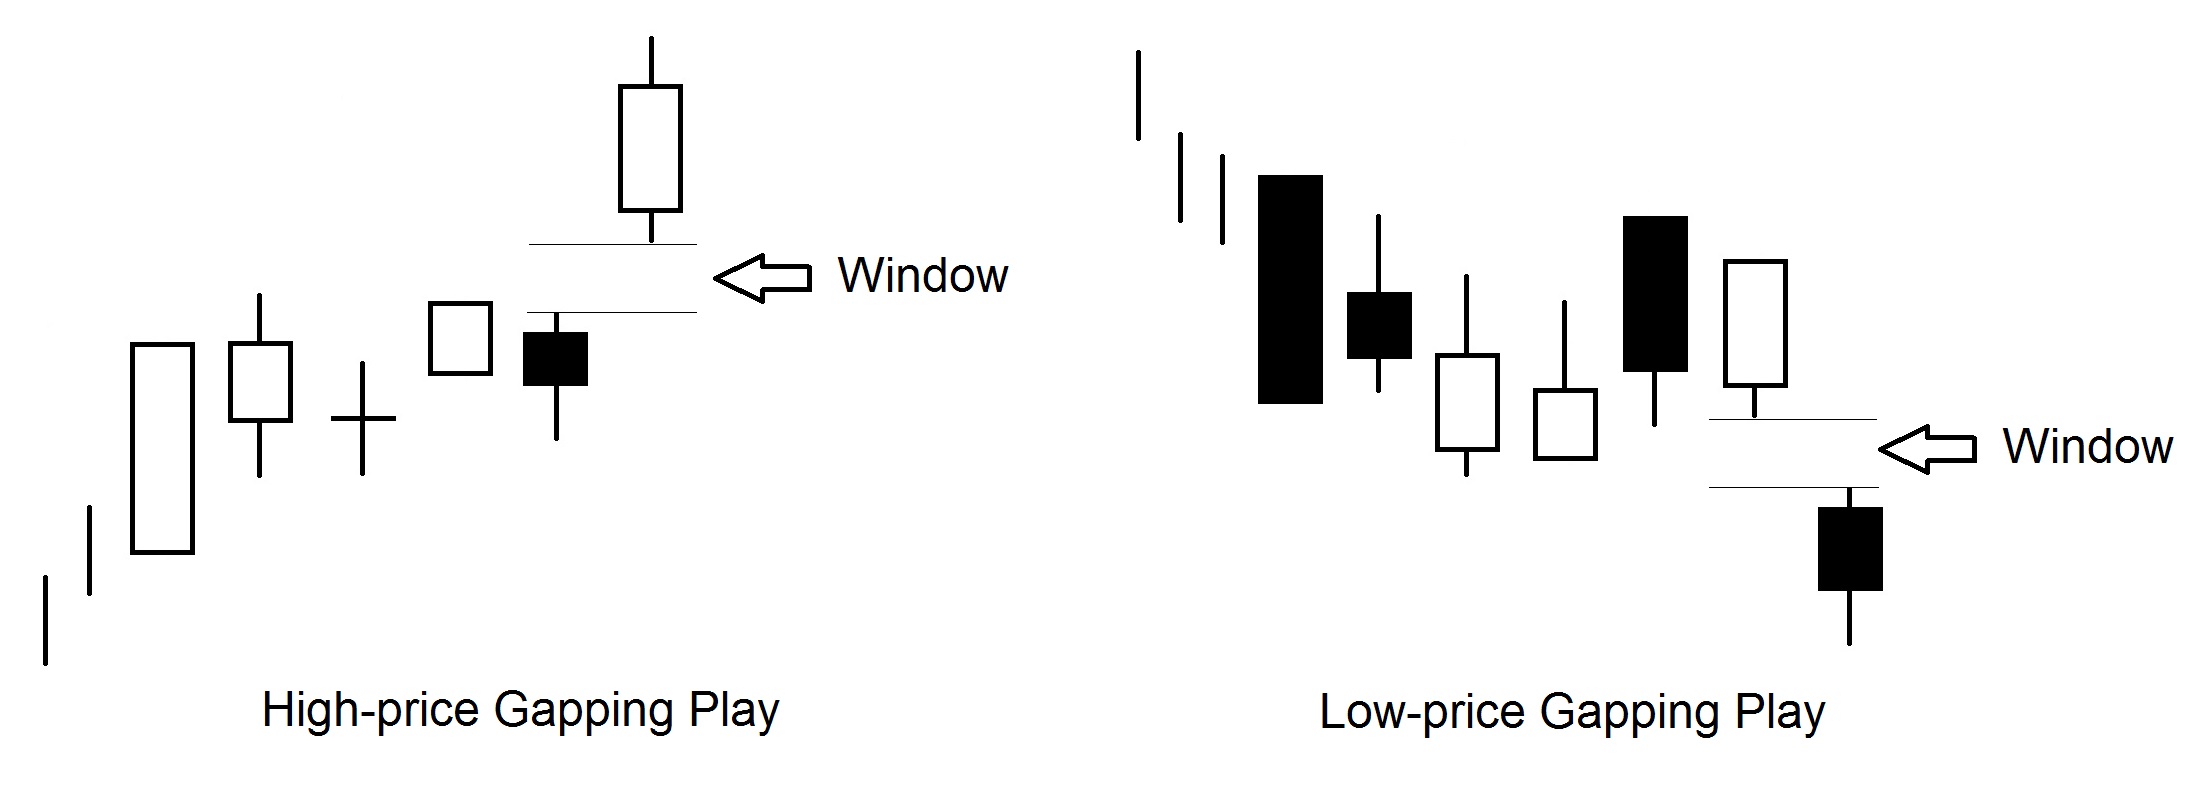
High-Price Gapping Play and Low-Price Gapping Play models
It is only natural that after a sharp increase in prices over one or two sessions, the market will consolidate this movement. During this period of consolidation, a group of small-body candles is often formed – this indicates the indecision of the market. However, if in one of the following days the price opens with a window on the top – it can be bought. This model is called High-Rrice Gapping Play. The Low-Rice Gapping Play trade is a bearish analogue to the model mentioned above.
The Gapping Play model suggests that market consolidation will continue for no more than 11 sessions. Consolidating candles are required to be located at the bottom (downward trend) or at the top of the price range (upward trend).
Model Gapping Side-by-Side White Lanes
(Gap of consecutive white candles)
If a white candle forms on the upward trend forming a window at the top, followed by another white candle, for example of such size and with almost the same opening price, then this is a bullish pattern of the continuation of the “Gap on top of consecutive white candles”. . If the market closes at a level higher than one of the two highest candles, then a further rise in prices should be expected. The model is very rare.
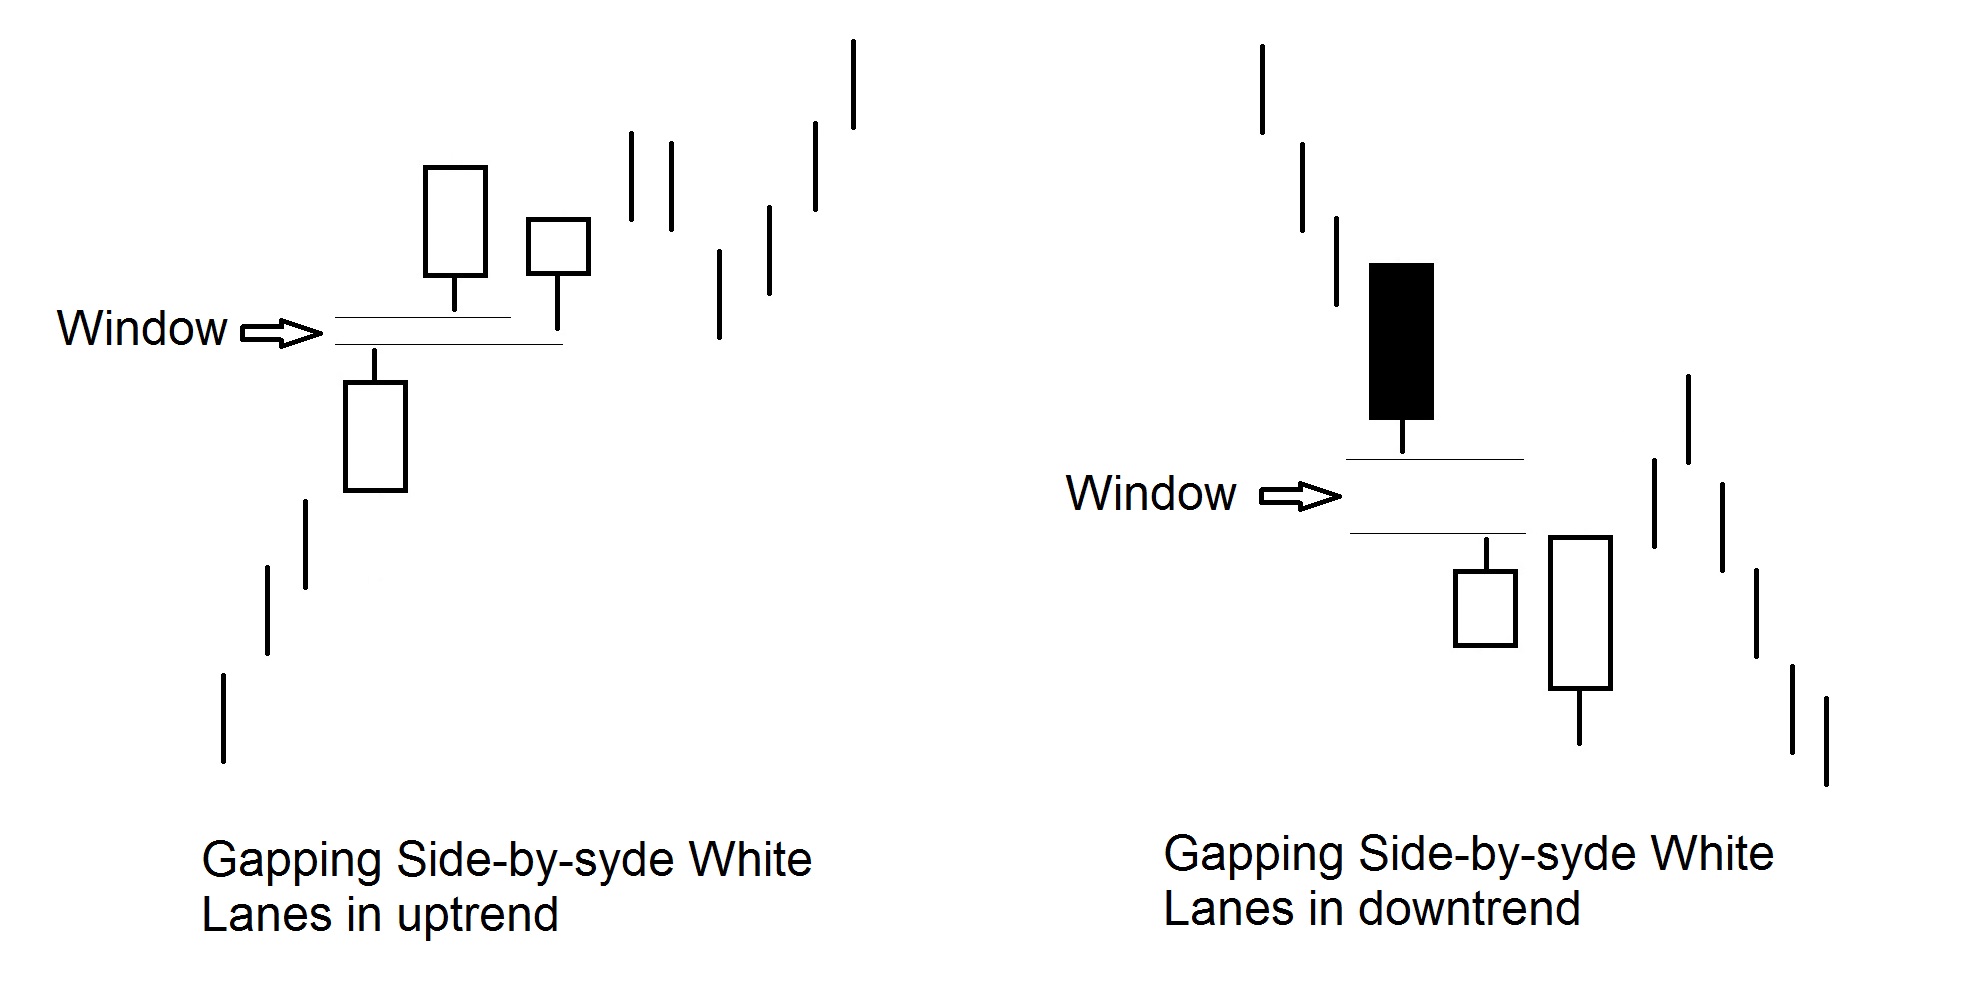
Even less common is Gap down on consecutive white candles with a downward trend. In the latter case, the appearance of two white candles is regarded as a partial closure of the short positions. Gap down most often occurs when a black (not white) candle appears. If, in a downtrend, the black candle forms a Gap downward, then another black candle with a much lower closing price will follow – this means that the downward trend in prices has persisted.
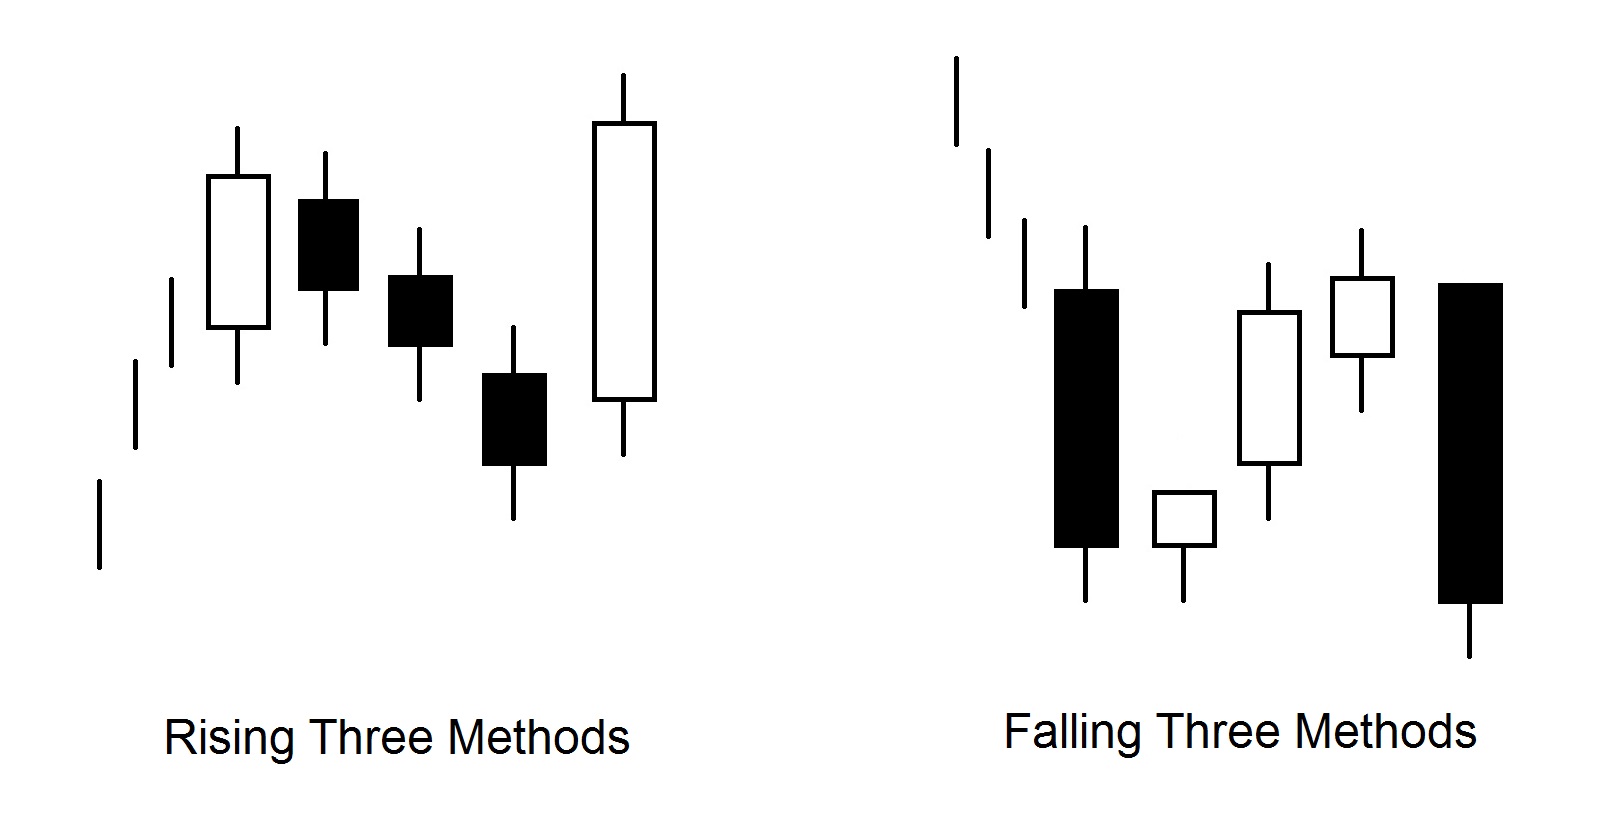
The Three Methods model
There are two variants of the given models: the Three Methods bullish model and the Three Methods bearish model. They confirm the trend.
The bullish model includes the following elements:
3 A long white candle
3 After this candle comes a group of black candles with small bodies. The ideal model contains three black candles, although there may be two or even more than three. The main thing, however, is that they do not go beyond the range (including the shadows) of the price of the long white candle. Some of the small-body candles may also be white, but most often they are black.
3 The last trading session should be represented by a long white candle with a closing price higher than the closing on the first day. The cost of detecting a black candle should also be higher than closing the previous day. This model is known in the West as Flag.
The Three Methods bear model is similarly shaped with mirror-like precision.
If the volume in the days of the appearance of a white (black) candle is bullish, the “three methods” model has a higher trading volume on the days of the appearance of small candles; this means that the importance of the model is increasing.
The Three Advancing White Soldiers model
(Three oncoming white soldiers)
The model is a group of three white candles with consecutively rising prices at the close of the session. If Three Advancing White Soldiers appear in the low price range after a stabilization period, it is a sign of potential market power. The cost of detecting each candle is within or near the white body of the preceding candle. The cost of closing a candle is equal to or near the maximum. However, if the candles are very stretched, then this is a sign of market glut.
If the second and third candles (or only the third candle) show signs of weight loss, an Advance Block model is formed. This suggests that the rise in price is meeting resistance, so bulls must defend their positions. When we encounter such a model, in the context of a long-term upward trend, we need to become more careful. A sign of weakening upward movement may be the gradually diminishing bodies of the white candles or the relatively long top shadows of the last two candles.
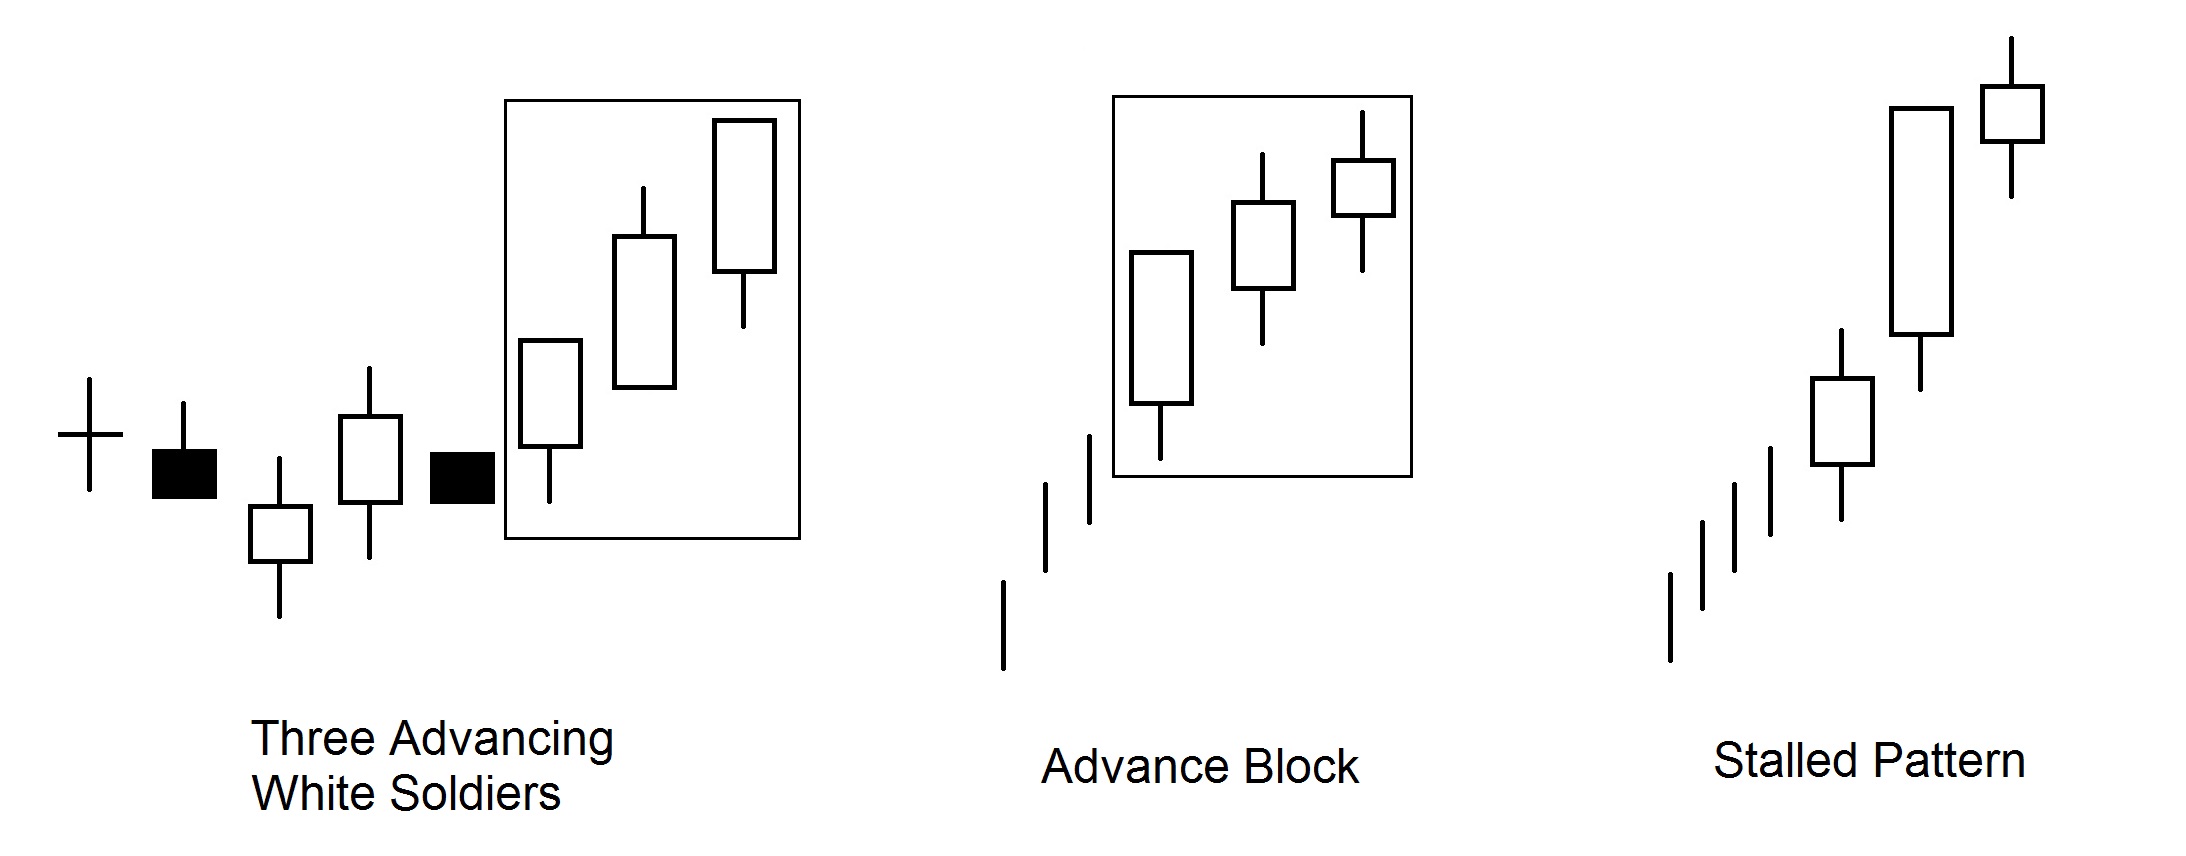
If the second candle has a long white body and registers a new maximum, followed by a small white candle, then the model formed is called Stalled Pattern. This signals that the pressure of the bulls has temporarily weakened. The last small candle can either form a tear about the long white body (in this case it becomes a star) or “stand on the shoulders” of the previous candle (ie, located on top of the previous long white body). The small white candle testifies to a decrease in the strength of the bull. With the appearance of the Stalled Pattern, it is advisable to close long positions and make a profit.
Although the Stalled Pattern and Advance Block models do not usually appear as a signal to reverse the movement of the top, they are usually followed by a significant decrease in prices. The emergence of these models involves the elimination or protection of the long position, but finding short positions in the given situation is not advisable. The main difference between Advance Block and Three Advancing White Soldiers is that the last white Advance Block candle has a longer upper shadow.
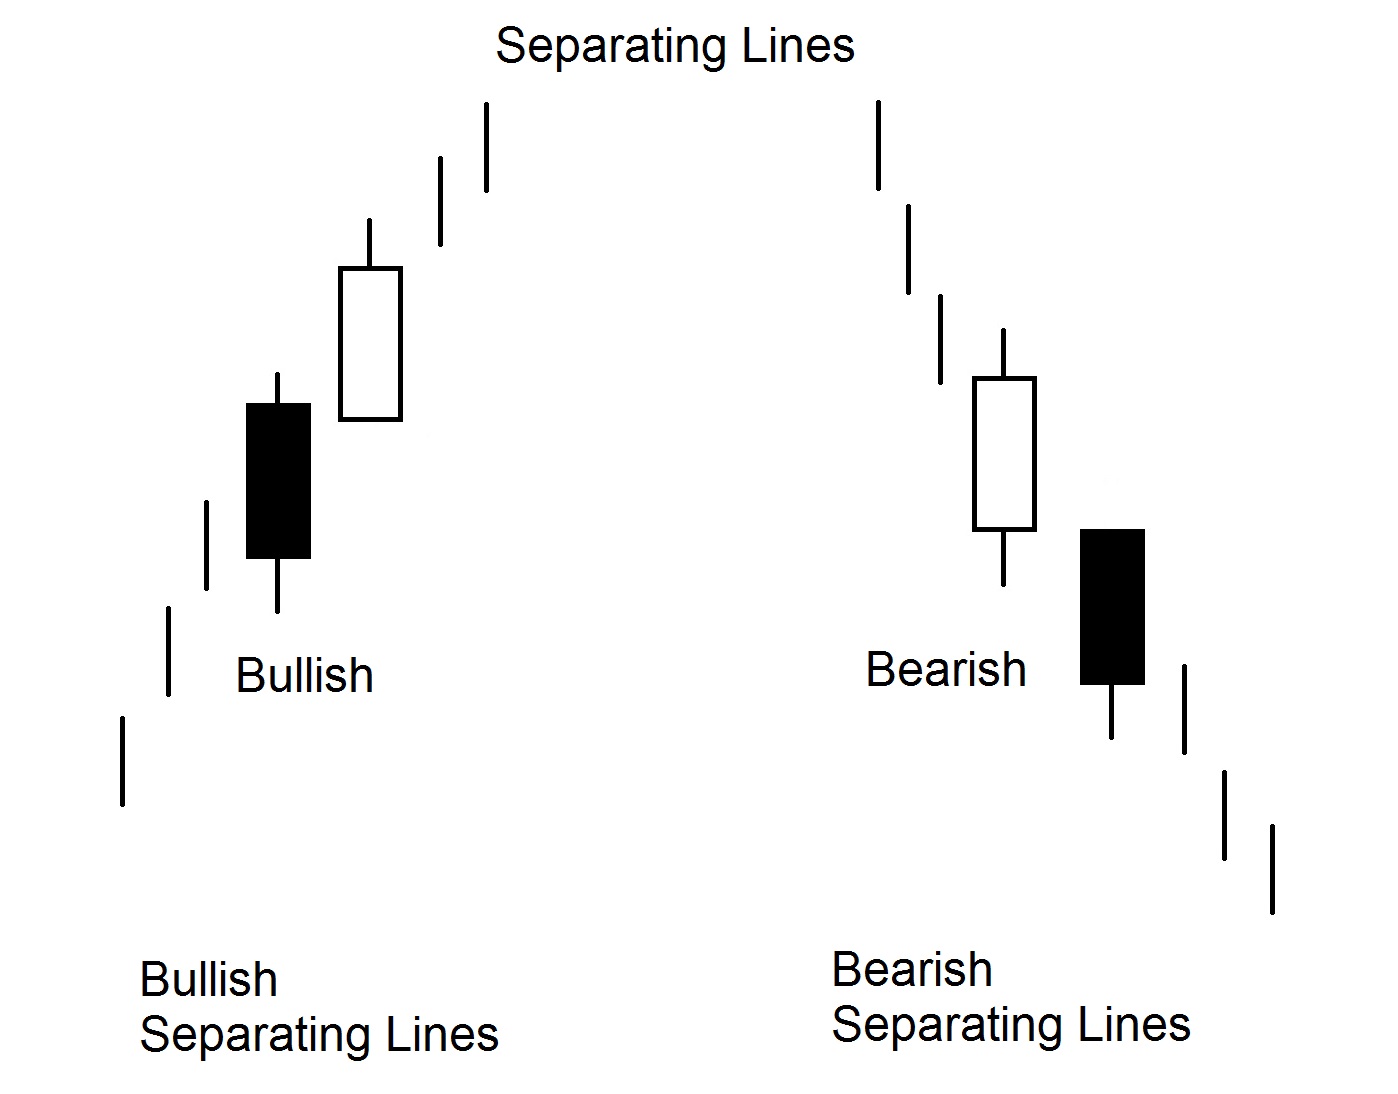
The Separating Lines model
(Dividing lines)
Unlike the Counterattack (Contrasted Candles) with Separating Lines, the second detachable candle has the same opening price as the Contrast Candle (Continued) model. The appearance of a black body candle (especially if it is long) against the background of the upward trend (bullish Separating Lines model) should alarm the bulls. This can give the bears confidence. However, if the next day the opening price forms a Gap at the top and reaches the opening price of the previous black candle, then that means the bulls are in control of the market again. The white candle is also a bull Belt hold.
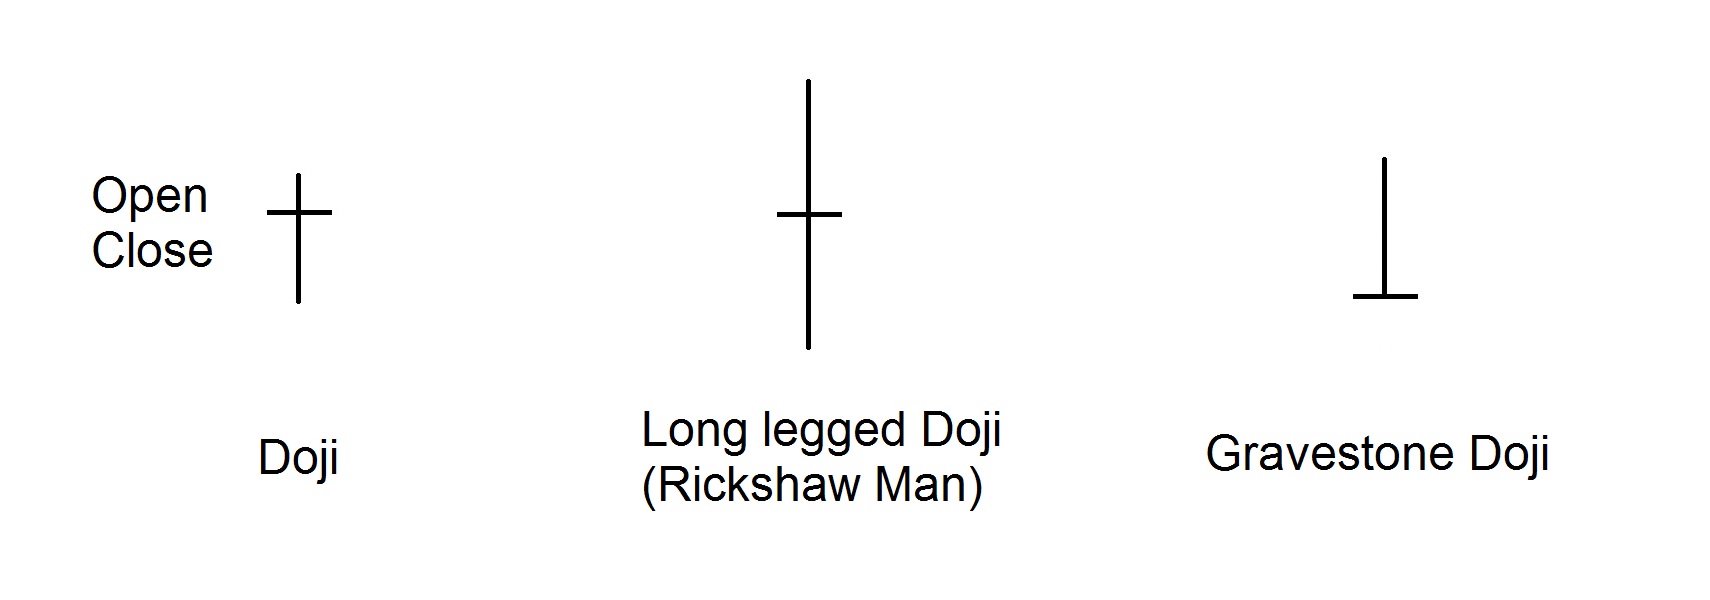
The Doji Model
Doji is a candle with an opening price equal to that at closing. If the opening and closing prices of the market are only a few ticks apart, then this candle is called Near Doji. How to determine if it is a Doji or Near Doji candle? If we have a row of candles with very small bodies, then a candle with close opening and closing values should not be considered a Doji. Another method is to evaluate the current market movement: if a dominant upward or downward trend is expected, the small-body candle is considered Near Doji. Doji candles are a very important signal, so it is better to take the risk than miss it because it indicates a change in trends. The likelihood of a reversal of the movement is increased if the subsequent movement of the prices is confirmed by this signal. Doji are only important in those markets where they are not common. Therefore, it is not recommended to use a candle analysis for a graph of less than 30 minutes, as there are many Doji-like graphics on such graphs.
Breastfeeding on top
Doji are particularly valued for their ability to identify the uptrend. This is especially true for those doji who appear after a long white candle. This doji property is associated with the fact that they signal market indecision. Bulls’ insecurity is unable to continue the uptrend in the market. If the market rises for a long time or is in a state of supersaturation, and then doji (indecision signal) appears, reversal of movement at the top is possible.
Doji after a long white candle
Doji that appear after a long white candle, especially after a long period of upward trend, are often warned about forming a market peak.
Rickshaw Man
Long Legged Doji plays a very important role if it comes out on top. If the opening and closing prices are in the middle of the day’s price range, then such a candle is called Rickshaw man. If the candle is not a Doji but has a very long tip and / or lower shadow and a small body, they call it a “high wave”. A group of “high waves” is a signal to reverse the movement.
Gravestone Breastfeeding
Occasionally, Doji tombstones appear at the heart of the market, but its primary purpose is to signal for peak formation. The bearish nature of the Doji tombstone is explained by the fact that the market opens at a minimal price and then follows a peak, but finally closes at the opening price, which is the minimum for the session. The higher the peak shadow, the stronger the bearish potential of Doji. Gravestone Doji is reminiscent of a falling star. On tops, this kind of Doji is a special kind of Shooting star. The difference is that Gravestone Doji has no body and has much stronger bearish potential than Shooting star.
Doji as a level of resistance and support
Doji candles, especially when encountered at important peaks or at the base of the price range, can sometimes also serve as a support or resistance function, depending on the direction of travel.
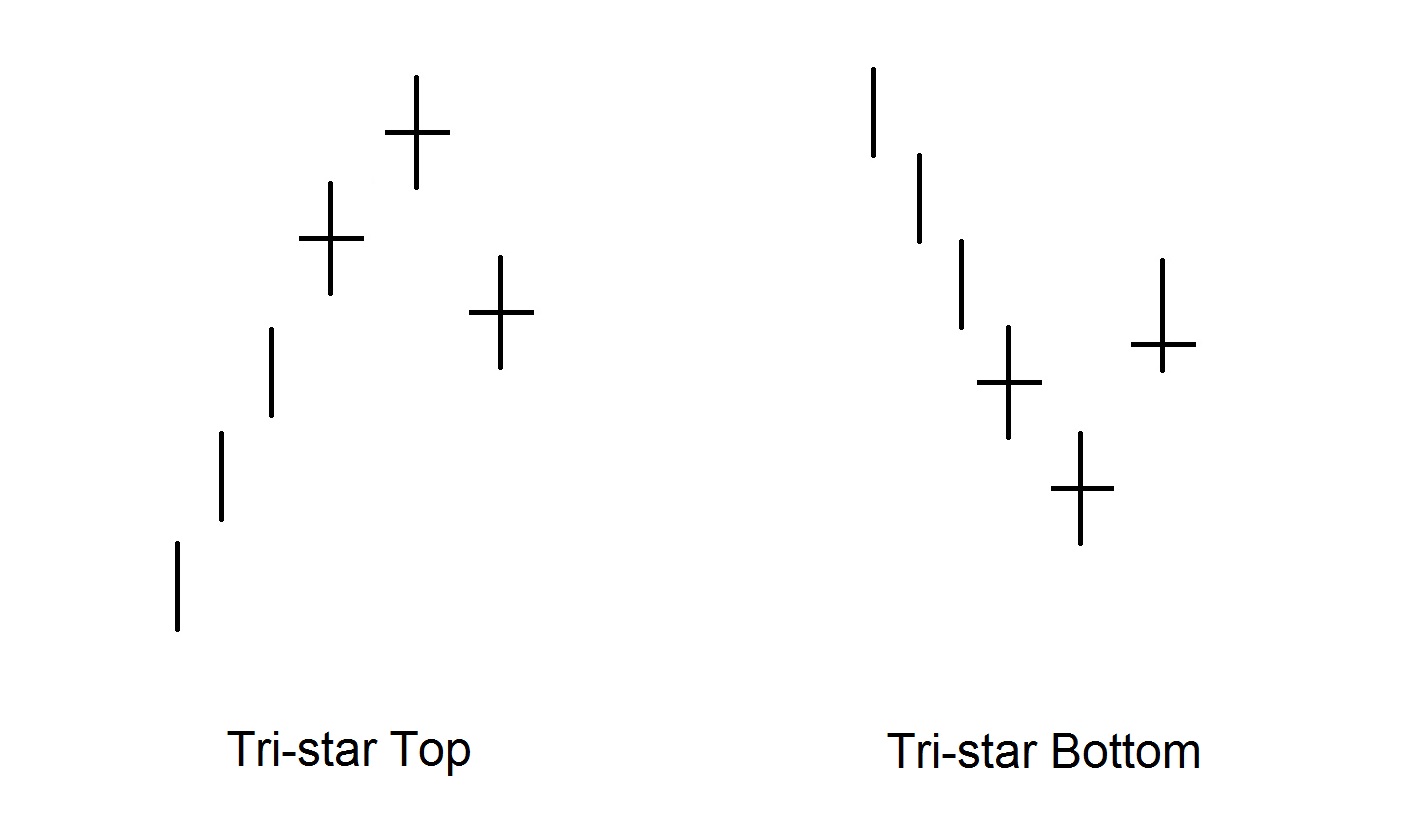
Tri-Star
The Tri-Star model is rare, but it is a very strong signal for reversing. It is formed by three Doji candles, the middle one must be Doji Star and the other two must be Doji or Near Doji. There are two types of Triple Star models – Tri-Star Top and Tri-Star Bottom. With the Tri-Star Top, the average candle opening price is Gap up from the first, and the third candle opens the Gap session down from the second.
There are many more combinations of candlestick patterns. We have selected just a few that work well for us and have limited the number to make things easier.
Following this section, a number of diagrams are presented showing candlestick patterns in their various shapes.
Disclaimer: The publications on this platform aim to provide useful information on financial topics. But they are NOT financial consultation or advice. Therefore they should not be used as a recommendation for making an investment decision on any type of financial products and services. We use in-depth research in the field but do not guarantee the completeness of the published materials. Always consult a specialist in your particular situation. "Applications In Life" Foundation is not responsible for any adverse consequences resulting from actions taken based on the information provided on the platform.